
|
Yantai Dongcheng Pharmaceutical Group Co. ، Ltd. (002675.SZ) تقييم DCF |
Fully Editable: Tailor To Your Needs In Excel Or Sheets
Professional Design: Trusted, Industry-Standard Templates
Investor-Approved Valuation Models
MAC/PC Compatible, Fully Unlocked
No Expertise Is Needed; Easy To Follow
Yantai Dongcheng Pharmaceutical Group Co.,Ltd. (002675.SZ) Bundle
Looking to assess the intrinsic value of Yantai Dongcheng Pharmaceutical Group Co., Ltd.? Our (002675SZ) DCF Calculator integrates real-world data with extensive customization features, enabling you to refine your forecasts and make more informed investment choices.
Discounted Cash Flow (DCF) - (USD MM)
| Year | AY1 2020 |
AY2 2021 |
AY3 2022 |
AY4 2023 |
AY5 2024 |
FY1 2025 |
FY2 2026 |
FY3 2027 |
FY4 2028 |
FY5 2029 |
|---|---|---|---|---|---|---|---|---|---|---|
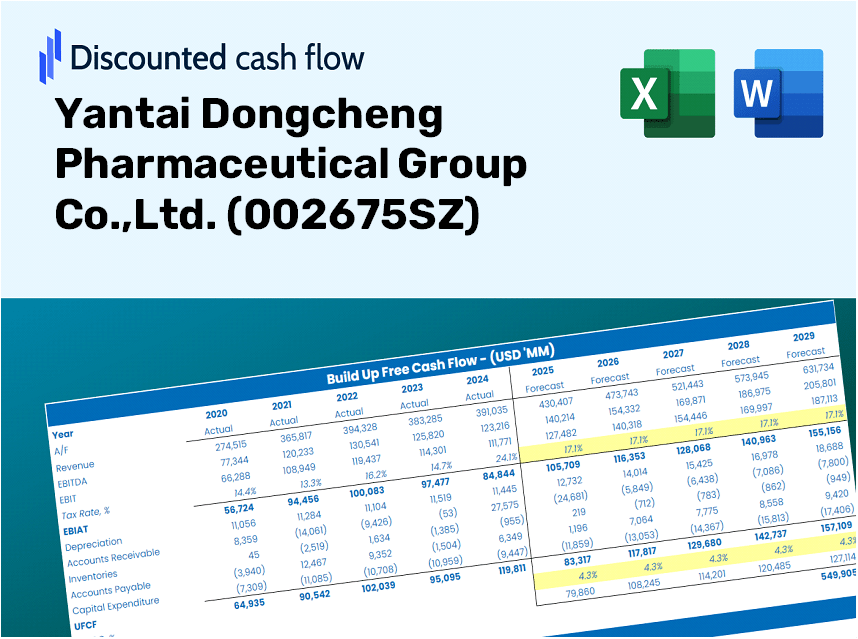
| Revenue | 3,419.0 | 3,912.0 | 3,583.0 | 3,275.6 | 2,868.9 | 2,761.5 | 2,658.0 | 2,558.5 | 2,462.6 | 2,370.4 |
| Revenue Growth, % | 0 | 14.42 | -8.41 | -8.58 | -12.42 | -3.75 | -3.75 | -3.75 | -3.75 | -3.75 |
| EBITDA | 727.8 | 727.9 | 672.1 | 511.7 | 432.7 | 493.5 | 475.0 | 457.2 | 440.1 | 423.6 |
| EBITDA, % | 21.29 | 18.61 | 18.76 | 15.62 | 15.08 | 17.87 | 17.87 | 17.87 | 17.87 | 17.87 |
| Depreciation | 102.7 | 114.9 | 120.4 | 137.9 | 150.1 | 103.5 | 99.6 | 95.9 | 92.3 | 88.9 |
| Depreciation, % | 3.01 | 2.94 | 3.36 | 4.21 | 5.23 | 3.75 | 3.75 | 3.75 | 3.75 | 3.75 |
| EBIT | 625.1 | 613.0 | 551.7 | 373.8 | 282.6 | 390.0 | 375.4 | 361.3 | 347.8 | 334.8 |
| EBIT, % | 18.28 | 15.67 | 15.4 | 11.41 | 9.85 | 14.12 | 14.12 | 14.12 | 14.12 | 14.12 |
| Total Cash | 833.8 | 955.9 | 1,049.0 | 664.5 | 904.5 | 717.5 | 690.6 | 664.8 | 639.9 | 615.9 |
| Total Cash, percent | .0 | .0 | .0 | .0 | .0 | .0 | .0 | .0 | .0 | .0 |
| Account Receivables | 1,004.8 | 875.5 | 883.5 | 794.1 | 948.7 | 738.6 | 711.0 | 684.3 | 658.7 | 634.0 |
| Account Receivables, % | 29.39 | 22.38 | 24.66 | 24.24 | 33.07 | 26.75 | 26.75 | 26.75 | 26.75 | 26.75 |
| Inventories | 974.0 | 952.5 | 1,078.1 | 903.9 | 646.2 | 734.8 | 707.3 | 680.8 | 655.3 | 630.7 |
| Inventories, % | 28.49 | 24.35 | 30.09 | 27.59 | 22.52 | 26.61 | 26.61 | 26.61 | 26.61 | 26.61 |
| Accounts Payable | 719.1 | 1,052.2 | 1,331.8 | 876.0 | 588.4 | 731.0 | 703.6 | 677.2 | 651.9 | 627.5 |
| Accounts Payable, % | 21.03 | 26.9 | 37.17 | 26.74 | 20.51 | 26.47 | 26.47 | 26.47 | 26.47 | 26.47 |
| Capital Expenditure | -262.2 | -530.2 | -389.6 | -511.9 | -456.1 | -351.4 | -338.2 | -325.5 | -313.3 | -301.6 |
| Capital Expenditure, % | -7.67 | -13.55 | -10.87 | -15.63 | -15.9 | -12.72 | -12.72 | -12.72 | -12.72 | -12.72 |
| Tax Rate, % | 16.1 | 16.1 | 16.1 | 16.1 | 16.1 | 16.1 | 16.1 | 16.1 | 16.1 | 16.1 |
| EBITAT | 427.1 | 260.9 | 380.5 | 232.4 | 237.1 | 254.2 | 244.7 | 235.5 | 226.7 | 218.2 |
| Depreciation | ||||||||||
| Changes in Account Receivables | ||||||||||
| Changes in Inventories | ||||||||||
| Changes in Accounts Payable | ||||||||||
| Capital Expenditure | ||||||||||
| UFCF | -992.1 | 329.6 | 257.3 | -333.7 | -253.5 | 270.5 | 33.9 | 32.7 | 31.5 | 30.3 |
| WACC, % | 7.37 | 7.17 | 7.37 | 7.32 | 7.49 | 7.34 | 7.34 | 7.34 | 7.34 | 7.34 |
| PV UFCF | ||||||||||
| SUM PV UFCF | 352.8 | |||||||||
| Long Term Growth Rate, % | 3.50 | |||||||||
| Free cash flow (T + 1) | 31 | |||||||||
| Terminal Value | 815 | |||||||||
| Present Terminal Value | 572 | |||||||||
| Enterprise Value | 925 | |||||||||
| Net Debt | 29 | |||||||||
| Equity Value | 896 | |||||||||
| Diluted Shares Outstanding, MM | 825 | |||||||||
| Equity Value Per Share | 1.09 |
Benefits You Will Receive
- Authentic Yantai Dongcheng Data: Preloaded financial information – covering everything from revenue to EBIT – based on real and projected data.
- Comprehensive Customization: Modify all essential parameters (yellow cells) including WACC, growth %, and tax rates.
- Real-Time Valuation Adjustments: Automatic recalculations to assess the effects of changes on Yantai Dongcheng’s fair value.
- Flexible Excel Template: Designed for quick modifications, scenario analysis, and thorough forecasting.
- Efficient and Precise: Eliminate the need to build models from the ground up while ensuring accuracy and adaptability.
Key Features
- Comprehensive DCF Calculator: Features detailed unlevered and levered DCF valuation models tailored for Yantai Dongcheng Pharmaceutical Group Co., Ltd. (002675SZ).
- WACC Calculation Tool: Includes a pre-configured Weighted Average Cost of Capital sheet with adjustable input parameters.
- Customizable Forecast Assumptions: Easily adjust growth rates, capital expenditures, and discount rates as needed.
- Integrated Financial Ratios: Evaluate profitability, leverage, and efficiency ratios specific to Yantai Dongcheng Pharmaceutical Group Co., Ltd. (002675SZ).
- Visual Dashboard and Charts: Provides visual representations of key valuation metrics for straightforward analysis.
How It Works
- Step 1: Download the Excel file.
- Step 2: Review Yantai Dongcheng Pharmaceutical Group Co., Ltd.'s pre-filled financial data and forecasts.
- Step 3: Adjust key inputs such as revenue growth, WACC, and tax rates (highlighted cells).
- Step 4: Observe the DCF model refresh in real-time as you modify your assumptions.
- Step 5: Evaluate the outputs and leverage the results for your investment decisions.
Why Opt for This Calculator?
- Designed for Experts: A sophisticated tool tailored for analysts, CFOs, and consultants.
- Real-Time Data: Yantai Dongcheng Pharmaceutical's (002675SZ) historical and projected financials preloaded for precision.
- Scenario Analysis: Effortlessly simulate various forecasts and assumptions.
- Clear Insights: Instantly calculates intrinsic value, NPV, and essential metrics.
- User-Friendly: Step-by-step guidance to navigate the process smoothly.
Who Can Benefit from This Product?
- Institutional Investors: Develop comprehensive and trustworthy valuation models for analyzing portfolios related to Yantai Dongcheng Pharmaceutical Group Co.,Ltd. (002675SZ).
- Corporate Finance Departments: Evaluate valuation scenarios to inform strategic decisions within the organization.
- Consultants and Financial Advisors: Deliver precise valuation insights for clients interested in Yantai Dongcheng Pharmaceutical Group Co.,Ltd. (002675SZ).
- Students and Instructors: Utilize real-case data to enhance financial modeling skills in an educational setting.
- Pharmaceutical Industry Enthusiasts: Gain insights into how pharmaceutical companies like Yantai Dongcheng Pharmaceutical Group Co.,Ltd. (002675SZ) are valued in the marketplace.
Contents of the Template
- Historical Data: Contains Yantai Dongcheng Pharmaceutical Group Co., Ltd.'s past financials and foundational forecasts.
- DCF and Levered DCF Models: Comprehensive templates for calculating the intrinsic value of Yantai Dongcheng ([002675SZ]).
- WACC Sheet: Pre-configured calculations for the Weighted Average Cost of Capital.
- Editable Inputs: Customize essential parameters such as growth rates, EBITDA percentages, and CAPEX assumptions.
- Quarterly and Annual Statements: A thorough breakdown of Yantai Dongcheng's financial data.
- Interactive Dashboard: Dynamic visualization of valuation outcomes and projections.
Disclaimer
All information, articles, and product details provided on this website are for general informational and educational purposes only. We do not claim any ownership over, nor do we intend to infringe upon, any trademarks, copyrights, logos, brand names, or other intellectual property mentioned or depicted on this site. Such intellectual property remains the property of its respective owners, and any references here are made solely for identification or informational purposes, without implying any affiliation, endorsement, or partnership.
We make no representations or warranties, express or implied, regarding the accuracy, completeness, or suitability of any content or products presented. Nothing on this website should be construed as legal, tax, investment, financial, medical, or other professional advice. In addition, no part of this site—including articles or product references—constitutes a solicitation, recommendation, endorsement, advertisement, or offer to buy or sell any securities, franchises, or other financial instruments, particularly in jurisdictions where such activity would be unlawful.
All content is of a general nature and may not address the specific circumstances of any individual or entity. It is not a substitute for professional advice or services. Any actions you take based on the information provided here are strictly at your own risk. You accept full responsibility for any decisions or outcomes arising from your use of this website and agree to release us from any liability in connection with your use of, or reliance upon, the content or products found herein.