
|
شركة Zhejiang Zhongjian Technology Co. ، Ltd (002779.SZ) تقييم DCF |
Fully Editable: Tailor To Your Needs In Excel Or Sheets
Professional Design: Trusted, Industry-Standard Templates
Investor-Approved Valuation Models
MAC/PC Compatible, Fully Unlocked
No Expertise Is Needed; Easy To Follow
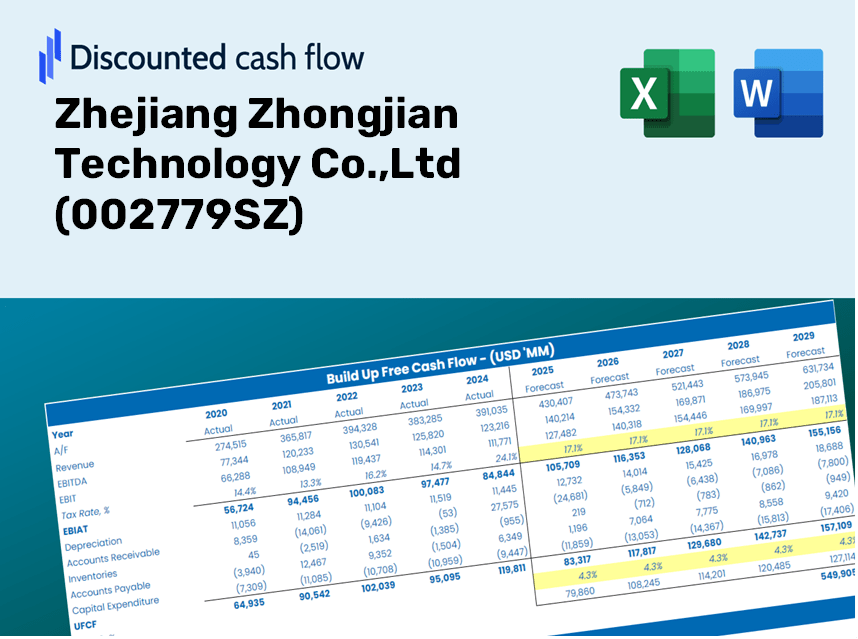
Zhejiang Zhongjian Technology Co.,Ltd (002779.SZ) Bundle
Optimize your time and improve precision with our (002779SZ) DCF Calculator! Utilizing real data from Zhejiang Zhongjian Technology Co., Ltd and customizable assumptions, this tool enables you to forecast, analyze, and evaluate (002779SZ) like a seasoned investor.
Discounted Cash Flow (DCF) - (USD MM)
| Year | AY1 2020 |
AY2 2021 |
AY3 2022 |
AY4 2023 |
AY5 2024 |
FY1 2025 |
FY2 2026 |
FY3 2027 |
FY4 2028 |
FY5 2029 |
|---|---|---|---|---|---|---|---|---|---|---|
| Revenue | 394.9 | 540.2 | 512.4 | 666.6 | 970.9 | 1,231.6 | 1,562.2 | 1,981.6 | 2,513.6 | 3,188.5 |
| Revenue Growth, % | 0 | 36.79 | -5.13 | 30.09 | 45.64 | 26.85 | 26.85 | 26.85 | 26.85 | 26.85 |
| EBITDA | -8.4 | 31.9 | 44.1 | 60.7 | 77.1 | 72.5 | 91.9 | 116.6 | 147.9 | 187.6 |
| EBITDA, % | -2.13 | 5.91 | 8.6 | 9.1 | 7.94 | 5.88 | 5.88 | 5.88 | 5.88 | 5.88 |
| Depreciation | 28.8 | 29.6 | 29.0 | 28.5 | 27.6 | 62.9 | 79.8 | 101.2 | 128.4 | 162.8 |
| Depreciation, % | 7.3 | 5.47 | 5.66 | 4.27 | 2.84 | 5.11 | 5.11 | 5.11 | 5.11 | 5.11 |
| EBIT | -37.2 | 2.4 | 15.1 | 32.2 | 49.6 | 9.6 | 12.1 | 15.4 | 19.5 | 24.8 |
| EBIT, % | -9.43 | 0.43742 | 2.94 | 4.83 | 5.11 | 0.77742 | 0.77742 | 0.77742 | 0.77742 | 0.77742 |
| Total Cash | 220.3 | 134.4 | 209.2 | 202.4 | 161.4 | 415.0 | 526.4 | 667.7 | 847.0 | 1,074.4 |
| Total Cash, percent | .0 | .0 | .0 | .0 | .0 | .0 | .0 | .0 | .0 | .0 |
| Account Receivables | 84.3 | 136.1 | 98.2 | 143.4 | 250.2 | 278.3 | 353.0 | 447.8 | 568.1 | 720.6 |
| Account Receivables, % | 21.35 | 25.2 | 19.16 | 21.52 | 25.77 | 22.6 | 22.6 | 22.6 | 22.6 | 22.6 |
| Inventories | 189.0 | 211.9 | 223.6 | 288.1 | 301.4 | 504.9 | 640.5 | 812.4 | 1,030.5 | 1,307.2 |
| Inventories, % | 47.87 | 39.22 | 43.64 | 43.21 | 31.04 | 41 | 41 | 41 | 41 | 41 |
| Accounts Payable | 174.1 | 173.3 | 167.7 | 207.8 | 248.2 | 408.0 | 517.6 | 656.5 | 832.8 | 1,056.4 |
| Accounts Payable, % | 44.1 | 32.09 | 32.73 | 31.18 | 25.57 | 33.13 | 33.13 | 33.13 | 33.13 | 33.13 |
| Capital Expenditure | -30.3 | -14.0 | -15.1 | -10.1 | -78.6 | -56.2 | -71.3 | -90.5 | -114.8 | -145.6 |
| Capital Expenditure, % | -7.68 | -2.59 | -2.95 | -1.52 | -8.1 | -4.57 | -4.57 | -4.57 | -4.57 | -4.57 |
| Tax Rate, % | 4.26 | 4.26 | 4.26 | 4.26 | 4.26 | 4.26 | 4.26 | 4.26 | 4.26 | 4.26 |
| EBITAT | -26.8 | 2.9 | 14.9 | 29.7 | 47.5 | 8.8 | 11.1 | 14.1 | 17.9 | 22.8 |
| Depreciation | ||||||||||
| Changes in Account Receivables | ||||||||||
| Changes in Inventories | ||||||||||
| Changes in Accounts Payable | ||||||||||
| Capital Expenditure | ||||||||||
| UFCF | -127.5 | -57.0 | 49.3 | -21.6 | -83.3 | -56.4 | -81.1 | -102.9 | -130.5 | -165.6 |
| WACC, % | 5.5 | 5.5 | 5.5 | 5.5 | 5.5 | 5.5 | 5.5 | 5.5 | 5.5 | 5.5 |
| PV UFCF | ||||||||||
| SUM PV UFCF | -446.0 | |||||||||
| Long Term Growth Rate, % | 4.00 | |||||||||
| Free cash flow (T + 1) | -172 | |||||||||
| Terminal Value | -11,480 | |||||||||
| Present Terminal Value | -8,784 | |||||||||
| Enterprise Value | -9,230 | |||||||||
| Net Debt | -130 | |||||||||
| Equity Value | -9,100 | |||||||||
| Diluted Shares Outstanding, MM | 132 | |||||||||
| Equity Value Per Share | -68.94 |
What You Will Receive
- Authentic Zhejiang Zhongjian Data: Preloaded financial metrics – from revenue to EBIT – based on actual and projected statistics.
- Complete Customization: Modify all essential parameters (yellow cells) such as WACC, growth %, and tax rates.
- Immediate Valuation Updates: Automatic recalculations to assess the effects of changes on Zhejiang Zhongjian's fair value.
- Flexible Excel Template: Designed for easy edits, scenario analysis, and thorough projections.
- Efficient and Accurate: Eliminate the need to create models from scratch while ensuring precision and adaptability.
Core Features
- Genuine Zhejiang Zhongjian Financials: Gain access to precise historical data and future projections for informed decision-making.
- Adjustable Forecast Parameters: Modify highlighted fields such as WACC, growth rates, and profit margins to tailor your analysis.
- Real-Time Calculations: Instant updates to DCF, Net Present Value (NPV), and cash flow assessments.
- User-Friendly Dashboard: Clear and concise charts and summaries to effectively display your valuation findings.
- Designed for Everyone: An easy-to-navigate layout suitable for investors, CFOs, and consultants, from novices to experts.
How It Works
- Step 1: Download the Excel file for Zhejiang Zhongjian Technology Co.,Ltd (002779SZ).
- Step 2: Review the pre-filled financial data and forecasts for Zhejiang Zhongjian Technology Co.,Ltd (002779SZ).
- Step 3: Adjust key inputs such as revenue growth, WACC, and tax rates (highlighted cells) for Zhejiang Zhongjian Technology Co.,Ltd (002779SZ).
- Step 4: Observe the DCF model update in real time as you modify your assumptions.
- Step 5: Analyze the results and leverage the insights for your investment decisions regarding Zhejiang Zhongjian Technology Co.,Ltd (002779SZ).
Why Opt for This Calculator for Zhejiang Zhongjian Technology Co., Ltd (002779SZ)?
- Reliable Data: Utilize authentic financial figures specific to Zhejiang Zhongjian Technology for trustworthy valuation outcomes.
- Customizable Features: Tailor essential parameters such as growth rates, WACC, and tax rates to align with your forecasts.
- Efficiency Boost: Built-in calculations save you the hassle of starting from the ground up.
- Professional Quality: Crafted for investors, analysts, and consultants engaging with Zhejiang Zhongjian Technology.
- User-Centric Design: Simple interface and comprehensive instructions ensure ease of use for everyone.
Who Can Benefit from This Product?
- Professional Investors: Develop comprehensive and accurate valuation models for evaluating investments in Zhejiang Zhongjian Technology Co., Ltd (002779SZ).
- Corporate Finance Teams: Examine valuation scenarios to inform strategic decision-making for the organization.
- Consultants and Advisors: Deliver precise valuation insights to clients focusing on Zhejiang Zhongjian Technology Co., Ltd (002779SZ).
- Students and Educators: Utilize real-world data to enhance learning and practice financial modeling techniques.
- Technology Enthusiasts: Gain insights into how technology firms like Zhejiang Zhongjian Technology Co., Ltd (002779SZ) are appraised in the financial market.
Contents of the Template
- Pre-Filled Data: Contains historical financials and projections for Zhejiang Zhongjian Technology Co., Ltd (002779SZ).
- Discounted Cash Flow Model: An editable DCF valuation model with automated calculations.
- Weighted Average Cost of Capital (WACC): A separate sheet for WACC calculation based on user-defined inputs.
- Key Financial Ratios: Evaluate Zhejiang Zhongjian's profitability, operational efficiency, and leverage.
- Customizable Inputs: Easily modify revenue growth rates, profit margins, and tax assumptions.
- Clear Dashboard: Visual representations and tables summarizing essential valuation metrics.
Disclaimer
All information, articles, and product details provided on this website are for general informational and educational purposes only. We do not claim any ownership over, nor do we intend to infringe upon, any trademarks, copyrights, logos, brand names, or other intellectual property mentioned or depicted on this site. Such intellectual property remains the property of its respective owners, and any references here are made solely for identification or informational purposes, without implying any affiliation, endorsement, or partnership.
We make no representations or warranties, express or implied, regarding the accuracy, completeness, or suitability of any content or products presented. Nothing on this website should be construed as legal, tax, investment, financial, medical, or other professional advice. In addition, no part of this site—including articles or product references—constitutes a solicitation, recommendation, endorsement, advertisement, or offer to buy or sell any securities, franchises, or other financial instruments, particularly in jurisdictions where such activity would be unlawful.
All content is of a general nature and may not address the specific circumstances of any individual or entity. It is not a substitute for professional advice or services. Any actions you take based on the information provided here are strictly at your own risk. You accept full responsibility for any decisions or outcomes arising from your use of this website and agree to release us from any liability in connection with your use of, or reliance upon, the content or products found herein.