
|
Hangzhou Weiguang Electronic Co. ، Ltd. (002801.SZ) تقييم DCF |
Fully Editable: Tailor To Your Needs In Excel Or Sheets
Professional Design: Trusted, Industry-Standard Templates
Investor-Approved Valuation Models
MAC/PC Compatible, Fully Unlocked
No Expertise Is Needed; Easy To Follow
Hangzhou Weiguang Electronic Co.,Ltd. (002801.SZ) Bundle
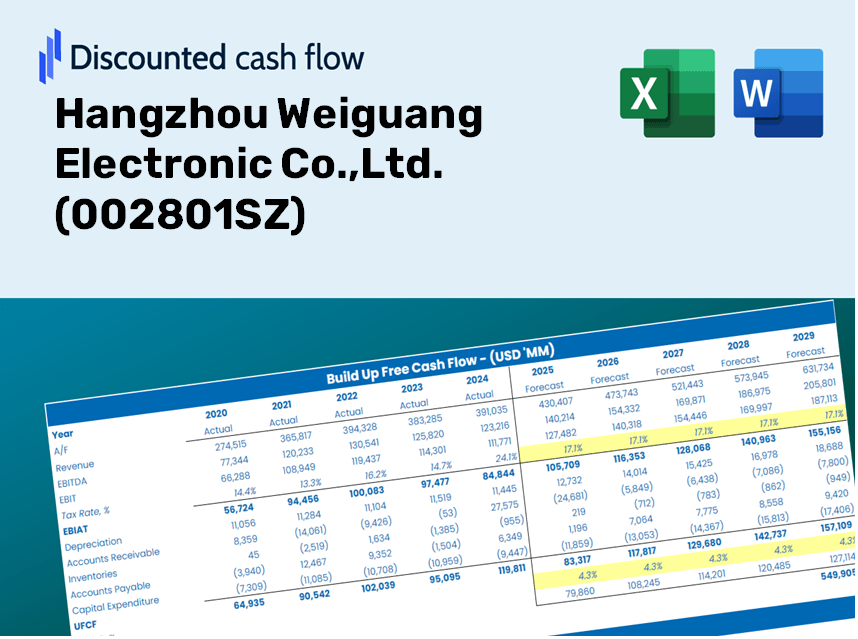
Gain insights into your Hangzhou Weiguang Electronic Co., Ltd. (002801SZ) valuation analysis using our sophisticated DCF Calculator! Equipped with real (002801SZ) data, this Excel template enables you to adjust forecasts and assumptions to accurately determine the intrinsic value of Hangzhou Weiguang Electronic Co., Ltd.
Discounted Cash Flow (DCF) - (USD MM)
| Year | AY1 2020 |
AY2 2021 |
AY3 2022 |
AY4 2023 |
AY5 2024 |
FY1 2025 |
FY2 2026 |
FY3 2027 |
FY4 2028 |
FY5 2029 |
|---|---|---|---|---|---|---|---|---|---|---|
| Revenue | 798.2 | 1,111.6 | 1,204.8 | 1,268.0 | 1,409.1 | 1,634.6 | 1,896.2 | 2,199.7 | 2,551.7 | 2,960.1 |
| Revenue Growth, % | 0 | 39.27 | 8.38 | 5.25 | 11.12 | 16 | 16 | 16 | 16 | 16 |
| EBITDA | 197.0 | 250.1 | 329.6 | 324.7 | 354.9 | 409.7 | 475.3 | 551.3 | 639.6 | 742.0 |
| EBITDA, % | 24.68 | 22.5 | 27.36 | 25.61 | 25.19 | 25.07 | 25.07 | 25.07 | 25.07 | 25.07 |
| Depreciation | 19.1 | 21.1 | 22.9 | 26.4 | 26.3 | 33.2 | 38.5 | 44.6 | 51.8 | 60.0 |
| Depreciation, % | 2.4 | 1.9 | 1.9 | 2.08 | 1.86 | 2.03 | 2.03 | 2.03 | 2.03 | 2.03 |
| EBIT | 177.8 | 229.0 | 306.7 | 298.3 | 328.6 | 376.6 | 436.8 | 506.7 | 587.8 | 681.9 |
| EBIT, % | 22.28 | 20.6 | 25.45 | 23.52 | 23.32 | 23.04 | 23.04 | 23.04 | 23.04 | 23.04 |
| Total Cash | 762.3 | 906.6 | 980.2 | 761.4 | 751.7 | 1,215.5 | 1,410.0 | 1,635.7 | 1,897.5 | 2,201.2 |
| Total Cash, percent | .0 | .0 | .0 | .0 | .0 | .0 | .0 | .0 | .0 | .0 |
| Account Receivables | 237.6 | 233.0 | 227.6 | 268.3 | 319.6 | 370.9 | 430.3 | 499.1 | 579.0 | 671.7 |
| Account Receivables, % | 29.76 | 20.96 | 18.89 | 21.16 | 22.68 | 22.69 | 22.69 | 22.69 | 22.69 | 22.69 |
| Inventories | 117.5 | 160.8 | 178.3 | 140.5 | 197.1 | 225.8 | 261.9 | 303.8 | 352.4 | 408.8 |
| Inventories, % | 14.72 | 14.47 | 14.8 | 11.08 | 13.99 | 13.81 | 13.81 | 13.81 | 13.81 | 13.81 |
| Accounts Payable | 153.5 | 165.2 | 146.9 | 219.0 | 239.4 | 263.4 | 305.5 | 354.4 | 411.1 | 476.9 |
| Accounts Payable, % | 19.24 | 14.86 | 12.2 | 17.27 | 16.99 | 16.11 | 16.11 | 16.11 | 16.11 | 16.11 |
| Capital Expenditure | -25.9 | -14.8 | -67.2 | -143.1 | -154.4 | -105.9 | -122.8 | -142.5 | -165.3 | -191.8 |
| Capital Expenditure, % | -3.24 | -1.33 | -5.58 | -11.28 | -10.96 | -6.48 | -6.48 | -6.48 | -6.48 | -6.48 |
| Tax Rate, % | 12.85 | 12.85 | 12.85 | 12.85 | 12.85 | 12.85 | 12.85 | 12.85 | 12.85 | 12.85 |
| EBITAT | 154.0 | 199.6 | 271.4 | 280.3 | 286.4 | 333.9 | 387.4 | 449.4 | 521.3 | 604.7 |
| Depreciation | ||||||||||
| Changes in Account Receivables | ||||||||||
| Changes in Inventories | ||||||||||
| Changes in Accounts Payable | ||||||||||
| Capital Expenditure | ||||||||||
| UFCF | -54.3 | 178.8 | 196.9 | 232.7 | 70.8 | 205.1 | 249.6 | 289.6 | 336.0 | 389.7 |
| WACC, % | 4.88 | 4.88 | 4.88 | 4.88 | 4.88 | 4.88 | 4.88 | 4.88 | 4.88 | 4.88 |
| PV UFCF | ||||||||||
| SUM PV UFCF | 1,258.3 | |||||||||
| Long Term Growth Rate, % | 3.50 | |||||||||
| Free cash flow (T + 1) | 403 | |||||||||
| Terminal Value | 29,183 | |||||||||
| Present Terminal Value | 22,994 | |||||||||
| Enterprise Value | 24,253 | |||||||||
| Net Debt | -623 | |||||||||
| Equity Value | 24,876 | |||||||||
| Diluted Shares Outstanding, MM | 230 | |||||||||
| Equity Value Per Share | 108.27 |
What You Will Receive
- Authentic Weiguang Data: Comprehensive financials – encompassing revenue to EBIT – derived from actual and forecasted data.
- Complete Customization: Modify all essential parameters (highlighted in yellow) such as WACC, growth rate, and tax percentages.
- Real-Time Valuation Updates: Automatic recalculations to assess the impact of adjustments on Weiguang’s fair value.
- Flexible Excel Template: Designed for quick modifications, scenario analysis, and in-depth projections.
- Efficient and Precise: Avoid starting from scratch while ensuring accuracy and adaptability.
Key Features
- Comprehensive DCF Calculator: Offers detailed unlevered and levered DCF valuation models tailored for Hangzhou Weiguang Electronic Co., Ltd. (002801SZ).
- WACC Calculator: Features a pre-built Weighted Average Cost of Capital sheet with adjustable parameters.
- Customizable Forecast Assumptions: Easily alter growth rates, capital expenditures, and discount rates to fit your analysis.
- Integrated Financial Ratios: Evaluate profitability, leverage, and efficiency ratios specifically for Hangzhou Weiguang Electronic Co., Ltd. (002801SZ).
- Visual Dashboard and Charts: Generate visual representations that summarize essential valuation metrics for straightforward analysis.
How It Works
- Step 1: Download the Excel file.
- Step 2: Examine the pre-filled financial data and forecasts for Hangzhou Weiguang Electronic Co., Ltd. (002801SZ).
- Step 3: Adjust key parameters such as revenue growth, WACC, and tax rates (highlighted cells).
- Step 4: Observe the DCF model update in real-time as you modify your assumptions.
- Step 5: Evaluate the results and leverage the findings for your investment strategies.
Why Choose Our Calculator for Hangzhou Weiguang Electronic Co., Ltd. (002801SZ)?
- Designed for Industry Experts: A sophisticated tool tailored for analysts, CFOs, and industry consultants.
- Comprehensive Data: Historical and anticipated financial information for Hangzhou Weiguang is preloaded to ensure precision.
- Flexible Scenario Analysis: Effortlessly model various forecasts and assumptions.
- Transparent Results: Instantly computes intrinsic value, NPV, and essential financial metrics.
- User-Friendly Interface: Step-by-step guidance makes navigation straightforward.
Who Would Benefit from This Product?
- Investors: Effectively assess the fair value of Hangzhou Weiguang Electronic Co., Ltd. (002801SZ) prior to making investment choices.
- CFOs: Utilize a top-tier DCF model for accurate financial reporting and comprehensive analysis.
- Consultants: Easily customize the template for client valuation reports.
- Entrepreneurs: Acquire knowledge of financial modeling techniques employed by leading firms.
- Educators: Incorporate it as a teaching resource to illustrate various valuation methods.
Contents of the Template
- Preloaded HWE Data: Historical and projected financial metrics, including revenue, EBIT, and capital investments.
- DCF and WACC Models: Advanced sheets designed for calculating intrinsic value and the Weighted Average Cost of Capital.
- Editable Inputs: Cells highlighted in yellow for easy adjustments to revenue growth, tax rates, and discount rates.
- Financial Statements: Detailed annual and quarterly financial reports for in-depth analysis.
- Key Ratios: Metrics for evaluating profitability, leverage, and efficiency.
- Dashboard and Charts: Visual representations of valuation results and key assumptions.
Disclaimer
All information, articles, and product details provided on this website are for general informational and educational purposes only. We do not claim any ownership over, nor do we intend to infringe upon, any trademarks, copyrights, logos, brand names, or other intellectual property mentioned or depicted on this site. Such intellectual property remains the property of its respective owners, and any references here are made solely for identification or informational purposes, without implying any affiliation, endorsement, or partnership.
We make no representations or warranties, express or implied, regarding the accuracy, completeness, or suitability of any content or products presented. Nothing on this website should be construed as legal, tax, investment, financial, medical, or other professional advice. In addition, no part of this site—including articles or product references—constitutes a solicitation, recommendation, endorsement, advertisement, or offer to buy or sell any securities, franchises, or other financial instruments, particularly in jurisdictions where such activity would be unlawful.
All content is of a general nature and may not address the specific circumstances of any individual or entity. It is not a substitute for professional advice or services. Any actions you take based on the information provided here are strictly at your own risk. You accept full responsibility for any decisions or outcomes arising from your use of this website and agree to release us from any liability in connection with your use of, or reliance upon, the content or products found herein.