
|
Foryou Corporation (002906.SZ) تقييم DCF |
Fully Editable: Tailor To Your Needs In Excel Or Sheets
Professional Design: Trusted, Industry-Standard Templates
Investor-Approved Valuation Models
MAC/PC Compatible, Fully Unlocked
No Expertise Is Needed; Easy To Follow
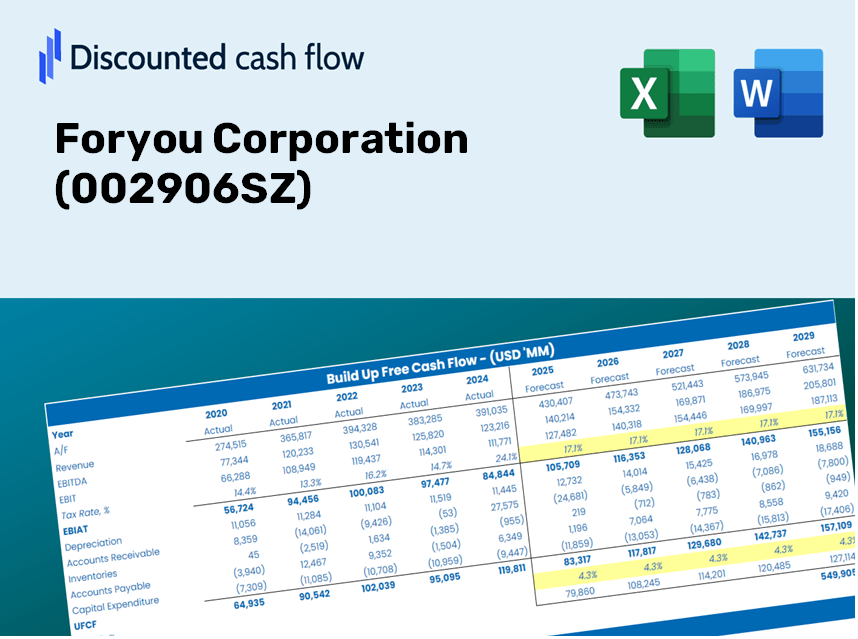
Foryou Corporation (002906.SZ) Bundle
Unleash the true potential of Foryou Corporation with our professional-grade DCF Calculator! Adjust key assumptions, explore various scenarios, and assess how changes affect Foryou Corporation's valuation – all within a single Excel template.
Discounted Cash Flow (DCF) - (USD MM)
| Year | AY1 2020 |
AY2 2021 |
AY3 2022 |
AY4 2023 |
AY5 2024 |
FY1 2025 |
FY2 2026 |
FY3 2027 |
FY4 2028 |
FY5 2029 |
|---|---|---|---|---|---|---|---|---|---|---|
| Revenue | 3,374.4 | 4,488.3 | 5,637.9 | 7,136.9 | 10,157.5 | 13,396.1 | 17,667.3 | 23,300.3 | 30,729.2 | 40,526.8 |
| Revenue Growth, % | 0 | 33.01 | 25.61 | 26.59 | 42.33 | 31.88 | 31.88 | 31.88 | 31.88 | 31.88 |
| EBITDA | 229.4 | 367.5 | 508.6 | 692.3 | 978.4 | 1,161.1 | 1,531.4 | 2,019.6 | 2,663.5 | 3,512.8 |
| EBITDA, % | 6.8 | 8.19 | 9.02 | 9.7 | 9.63 | 8.67 | 8.67 | 8.67 | 8.67 | 8.67 |
| Depreciation | 127.1 | 145.3 | 185.8 | 243.7 | 284.8 | 442.6 | 583.7 | 769.8 | 1,015.2 | 1,338.9 |
| Depreciation, % | 3.77 | 3.24 | 3.3 | 3.41 | 2.8 | 3.3 | 3.3 | 3.3 | 3.3 | 3.3 |
| EBIT | 102.2 | 222.2 | 322.8 | 448.7 | 693.6 | 718.6 | 947.7 | 1,249.9 | 1,648.4 | 2,173.9 |
| EBIT, % | 3.03 | 4.95 | 5.73 | 6.29 | 6.83 | 5.36 | 5.36 | 5.36 | 5.36 | 5.36 |
| Total Cash | 793.9 | 971.2 | 752.5 | 1,614.1 | 1,233.6 | 2,499.0 | 3,295.8 | 4,346.6 | 5,732.4 | 7,560.1 |
| Total Cash, percent | .0 | .0 | .0 | .0 | .0 | .0 | .0 | .0 | .0 | .0 |
| Account Receivables | 1,948.9 | 2,072.4 | 2,452.2 | 3,641.0 | 5,637.1 | 6,803.5 | 8,972.7 | 11,833.5 | 15,606.5 | 20,582.4 |
| Account Receivables, % | 57.75 | 46.17 | 43.49 | 51.02 | 55.5 | 50.79 | 50.79 | 50.79 | 50.79 | 50.79 |
| Inventories | 686.5 | 913.7 | 1,233.5 | 1,279.8 | 1,669.3 | 2,597.5 | 3,425.6 | 4,517.8 | 5,958.3 | 7,858.0 |
| Inventories, % | 20.34 | 20.36 | 21.88 | 17.93 | 16.43 | 19.39 | 19.39 | 19.39 | 19.39 | 19.39 |
| Accounts Payable | 993.1 | 1,211.1 | 1,927.6 | 2,601.4 | 4,528.9 | 4,598.6 | 6,064.9 | 7,998.6 | 10,548.8 | 13,912.1 |
| Accounts Payable, % | 29.43 | 26.98 | 34.19 | 36.45 | 44.59 | 34.33 | 34.33 | 34.33 | 34.33 | 34.33 |
| Capital Expenditure | -219.4 | -296.7 | -438.2 | -653.2 | -903.5 | -1,043.1 | -1,375.7 | -1,814.3 | -2,392.7 | -3,155.6 |
| Capital Expenditure, % | -6.5 | -6.61 | -7.77 | -9.15 | -8.89 | -7.79 | -7.79 | -7.79 | -7.79 | -7.79 |
| Tax Rate, % | 6.86 | 6.86 | 6.86 | 6.86 | 6.86 | 6.86 | 6.86 | 6.86 | 6.86 | 6.86 |
| EBITAT | 105.9 | 245.7 | 348.2 | 440.6 | 646.1 | 706.2 | 931.3 | 1,228.2 | 1,619.9 | 2,136.3 |
| Depreciation | ||||||||||
| Changes in Account Receivables | ||||||||||
| Changes in Inventories | ||||||||||
| Changes in Accounts Payable | ||||||||||
| Capital Expenditure | ||||||||||
| UFCF | -1,628.6 | -38.6 | 112.7 | -530.1 | -430.8 | -1,919.2 | -1,391.8 | -1,835.6 | -2,420.9 | -3,192.7 |
| WACC, % | 7.91 | 7.91 | 7.91 | 7.91 | 7.9 | 7.91 | 7.91 | 7.91 | 7.91 | 7.91 |
| PV UFCF | ||||||||||
| SUM PV UFCF | -8,402.5 | |||||||||
| Long Term Growth Rate, % | 4.00 | |||||||||
| Free cash flow (T + 1) | -3,320 | |||||||||
| Terminal Value | -84,970 | |||||||||
| Present Terminal Value | -58,077 | |||||||||
| Enterprise Value | -66,480 | |||||||||
| Net Debt | -859 | |||||||||
| Equity Value | -65,621 | |||||||||
| Diluted Shares Outstanding, MM | 525 | |||||||||
| Equity Value Per Share | -124.92 |
What You Will Receive
- Flexible Forecast Inputs: Modify key assumptions (growth %, profit margins, WACC) to generate various scenarios effortlessly.
- Real-World Financial Data: Foryou Corporation's financial information pre-loaded to facilitate your analysis.
- Automated DCF Calculations: The template computes Net Present Value (NPV) and intrinsic value seamlessly for you.
- Professional and Customizable: A refined Excel model tailored to fit your valuation requirements.
- Designed for Analysts and Investors: Perfect for exploring forecasts, validating strategies, and optimizing your time.
Core Features
- Authentic Financial Data: Gain access to precise historical figures and future forecasts for Foryou Corporation (002906SZ).
- Adjustable Forecast Parameters: Modify highlighted fields such as WACC, growth rates, and profit margins.
- Real-Time Calculations: Instant updates for DCF, Net Present Value (NPV), and cash flow assessments.
- Interactive Dashboard: User-friendly charts and summaries to clearly present your valuation findings.
- Designed for All Levels: An intuitive layout catering to investors, CFOs, and consultants alike.
How It Functions
- Download: Get the pre-built Excel file containing Foryou Corporation's (002906SZ) financial data.
- Customize: Modify projections such as revenue growth, EBITDA %, and WACC as needed.
- Real-Time Updates: Intrinsic value and NPV calculations refresh automatically as you make changes.
- Scenario Testing: Generate various forecasts and compare results instantly.
- Informed Decisions: Leverage the valuation outcomes to enhance your investment strategy.
Why Opt for This Calculator?
- User-Friendly and Accessible: Perfectly crafted for both novices and seasoned professionals.
- Customizable Inputs: Easily adjust parameters to suit your analysis needs.
- Real-Time Updates: Monitor immediate changes in Foryou Corporation’s valuation as you modify inputs.
- Preconfigured Data: Comes pre-loaded with Foryou Corporation's actual financial information for swift evaluation.
- Relied Upon by Experts: Favored by investors and analysts for making well-informed choices.
Who Can Benefit from This Product?
- Individual Investors: Make well-informed decisions regarding the purchase or sale of Foryou Corporation (002906SZ) stock.
- Financial Analysts: Enhance your valuation processes with comprehensive financial models at your disposal.
- Consultants: Provide clients with precise and timely valuation insights.
- Business Owners: Gain insights into the valuation of major companies like Foryou Corporation (002906SZ) to inform your own business strategy.
- Finance Students: Master valuation techniques using real-time data and industry scenarios.
Overview of the Template Features
- In-Depth DCF Model: An editable template that includes comprehensive valuation calculations.
- Real-World Data: Historical and projected financials for Foryou Corporation (002906SZ) are preloaded for your analysis.
- Customizable Variables: Modify WACC, growth rates, and tax assumptions to explore different scenarios.
- Financial Statements: Detailed annual and quarterly reports for enhanced analysis.
- Essential Ratios: Integrated evaluation for profitability, efficiency, and leverage metrics.
- Visual Dashboard: Graphs and tables that present clear, actionable insights.
Disclaimer
All information, articles, and product details provided on this website are for general informational and educational purposes only. We do not claim any ownership over, nor do we intend to infringe upon, any trademarks, copyrights, logos, brand names, or other intellectual property mentioned or depicted on this site. Such intellectual property remains the property of its respective owners, and any references here are made solely for identification or informational purposes, without implying any affiliation, endorsement, or partnership.
We make no representations or warranties, express or implied, regarding the accuracy, completeness, or suitability of any content or products presented. Nothing on this website should be construed as legal, tax, investment, financial, medical, or other professional advice. In addition, no part of this site—including articles or product references—constitutes a solicitation, recommendation, endorsement, advertisement, or offer to buy or sell any securities, franchises, or other financial instruments, particularly in jurisdictions where such activity would be unlawful.
All content is of a general nature and may not address the specific circumstances of any individual or entity. It is not a substitute for professional advice or services. Any actions you take based on the information provided here are strictly at your own risk. You accept full responsibility for any decisions or outcomes arising from your use of this website and agree to release us from any liability in connection with your use of, or reliance upon, the content or products found herein.