
|
Chongqing Pharscin Pharmaceutical Co.، Ltd. (002907.SZ) تقييم DCF |
Fully Editable: Tailor To Your Needs In Excel Or Sheets
Professional Design: Trusted, Industry-Standard Templates
Investor-Approved Valuation Models
MAC/PC Compatible, Fully Unlocked
No Expertise Is Needed; Easy To Follow
Chongqing Pharscin Pharmaceutical Co., Ltd. (002907.SZ) Bundle
Streamline your analysis and improve precision with our (002907SZ) DCF Calculator! Utilizing real data from Chongqing Pharscin Pharmaceutical Co., Ltd. and customizable assumptions, this tool empowers you to forecast, analyze, and value (002907SZ) like a seasoned investor.
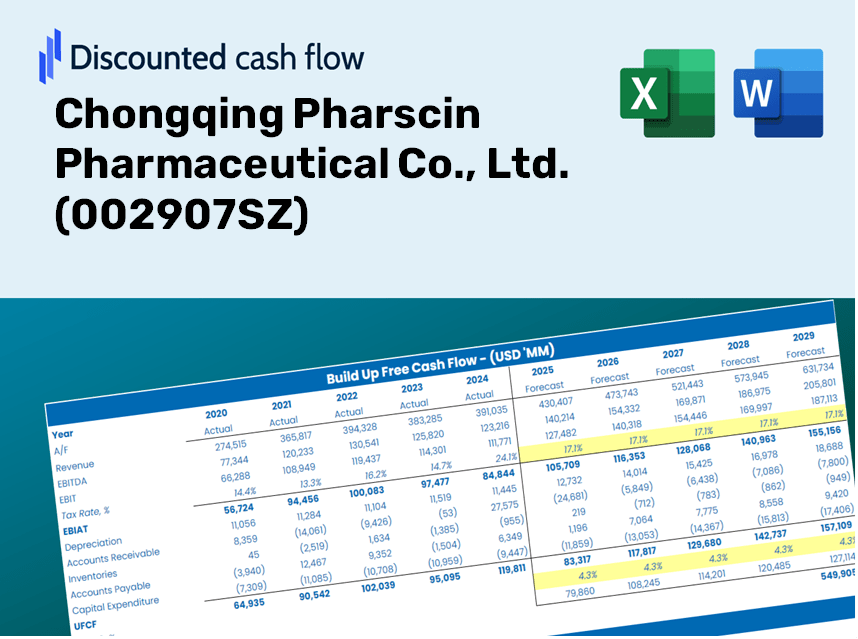
Discounted Cash Flow (DCF) - (USD MM)
| Year | AY1 2020 |
AY2 2021 |
AY3 2022 |
AY4 2023 |
AY5 2024 |
FY1 2025 |
FY2 2026 |
FY3 2027 |
FY4 2028 |
FY5 2029 |
|---|---|---|---|---|---|---|---|---|---|---|
| Revenue | 882.5 | 846.1 | 785.2 | 691.5 | 774.8 | 753.1 | 732.0 | 711.5 | 691.6 | 672.2 |
| Revenue Growth, % | 0 | -4.12 | -7.2 | -11.93 | 12.04 | -2.8 | -2.8 | -2.8 | -2.8 | -2.8 |
| EBITDA | 202.2 | 193.0 | 200.5 | 125.8 | 179.9 | 169.7 | 164.9 | 160.3 | 155.8 | 151.5 |
| EBITDA, % | 22.92 | 22.8 | 25.53 | 18.2 | 23.21 | 22.53 | 22.53 | 22.53 | 22.53 | 22.53 |
| Depreciation | 47.3 | 69.8 | 72.6 | 82.1 | 86.9 | 69.2 | 67.3 | 65.4 | 63.6 | 61.8 |
| Depreciation, % | 5.36 | 8.25 | 9.25 | 11.87 | 11.22 | 9.19 | 9.19 | 9.19 | 9.19 | 9.19 |
| EBIT | 154.9 | 123.1 | 127.8 | 43.7 | 92.9 | 100.5 | 97.7 | 94.9 | 92.3 | 89.7 |
| EBIT, % | 17.55 | 14.55 | 16.28 | 6.33 | 11.99 | 13.34 | 13.34 | 13.34 | 13.34 | 13.34 |
| Total Cash | 531.5 | 510.6 | 503.5 | 437.6 | 577.2 | 485.7 | 472.1 | 458.9 | 446.0 | 433.5 |
| Total Cash, percent | .0 | .0 | .0 | .0 | .0 | .0 | .0 | .0 | .0 | .0 |
| Account Receivables | 229.4 | 242.7 | 324.6 | 249.5 | 275.6 | 252.5 | 245.5 | 238.6 | 231.9 | 225.4 |
| Account Receivables, % | 25.99 | 28.68 | 41.34 | 36.09 | 35.57 | 33.53 | 33.53 | 33.53 | 33.53 | 33.53 |
| Inventories | 118.6 | 127.4 | 114.8 | 151.7 | 140.1 | 125.2 | 121.7 | 118.3 | 115.0 | 111.8 |
| Inventories, % | 13.44 | 15.06 | 14.62 | 21.93 | 18.08 | 16.63 | 16.63 | 16.63 | 16.63 | 16.63 |
| Accounts Payable | 92.0 | 76.1 | 48.0 | 55.2 | 64.4 | 63.0 | 61.3 | 59.5 | 57.9 | 56.2 |
| Accounts Payable, % | 10.43 | 8.99 | 6.12 | 7.99 | 8.31 | 8.37 | 8.37 | 8.37 | 8.37 | 8.37 |
| Capital Expenditure | -46.7 | -56.6 | -60.6 | -92.8 | -16.2 | -53.0 | -51.6 | -50.1 | -48.7 | -47.3 |
| Capital Expenditure, % | -5.29 | -6.69 | -7.72 | -13.42 | -2.08 | -7.04 | -7.04 | -7.04 | -7.04 | -7.04 |
| Tax Rate, % | 17.88 | 17.88 | 17.88 | 17.88 | 17.88 | 17.88 | 17.88 | 17.88 | 17.88 | 17.88 |
| EBITAT | 134.7 | 109.3 | 116.2 | 33.4 | 76.3 | 85.4 | 83.0 | 80.7 | 78.4 | 76.2 |
| Depreciation | ||||||||||
| Changes in Account Receivables | ||||||||||
| Changes in Inventories | ||||||||||
| Changes in Accounts Payable | ||||||||||
| Capital Expenditure | ||||||||||
| UFCF | -120.5 | 84.3 | 30.9 | 68.1 | 141.7 | 138.2 | 107.6 | 104.6 | 101.6 | 98.8 |
| WACC, % | 4.53 | 4.53 | 4.53 | 4.53 | 4.53 | 4.53 | 4.53 | 4.53 | 4.53 | 4.53 |
| PV UFCF | ||||||||||
| SUM PV UFCF | 486.5 | |||||||||
| Long Term Growth Rate, % | 4.00 | |||||||||
| Free cash flow (T + 1) | 103 | |||||||||
| Terminal Value | 19,243 | |||||||||
| Present Terminal Value | 15,417 | |||||||||
| Enterprise Value | 15,903 | |||||||||
| Net Debt | -457 | |||||||||
| Equity Value | 16,360 | |||||||||
| Diluted Shares Outstanding, MM | 418 | |||||||||
| Equity Value Per Share | 39.17 |
Your Benefits
- Customizable Excel Template: A fully adjustable Excel-based DCF Calculator featuring pre-filled financial data for Chongqing Pharscin Pharmaceutical Co., Ltd. (002907SZ).
- Actual Market Data: Access to historical performance data and forward-looking estimates (highlighted in the yellow cells).
- Adjustable Forecasts: Modify key assumptions such as revenue growth, EBITDA percentage, and WACC.
- Instant Calculations: Quickly observe how your inputs affect the valuation of Chongqing Pharscin Pharmaceutical Co., Ltd. (002907SZ).
- Professional Solution: Designed for investors, CFOs, consultants, and financial analysts.
- User-Friendly Interface: Organized for simplicity and clarity, complete with easy-to-follow instructions.
Key Features
- 🔍 Real-Life (002907SZ) Financials: Pre-filled historical and projected data for Chongqing Pharscin Pharmaceutical Co., Ltd.
- ✏️ Fully Customizable Inputs: Adjust all essential parameters (yellow cells) such as WACC, growth %, and tax rates.
- 📊 Professional DCF Valuation: Built-in formulas compute Chongqing Pharscin's intrinsic value using the Discounted Cash Flow method.
- ⚡ Instant Results: Visualize Chongqing Pharscin's valuation immediately after making adjustments.
- Scenario Analysis: Test and compare outcomes for different financial assumptions side-by-side.
How It Works
- Step 1: Download the Excel file for Chongqing Pharscin Pharmaceutical Co., Ltd. (002907SZ).
- Step 2: Review the pre-filled financial data and forecasts pertaining to Chongqing Pharscin.
- Step 3: Adjust key inputs such as revenue growth, WACC, and tax rates (marked cells).
- Step 4: Observe as the DCF model updates in real-time with your changes.
- Step 5: Evaluate the results and leverage them for making informed investment decisions.
Why Select This Calculator for Chongqing Pharscin Pharmaceutical Co., Ltd. (002907SZ)?
- All-in-One Solution: Features DCF, WACC, and comprehensive financial ratio analyses in a single tool.
- Adjustable Parameters: Modify the yellow-highlighted fields to explore different financial scenarios.
- In-Depth Analysis: Automatically computes the intrinsic value and Net Present Value for Chongqing Pharscin Pharmaceutical Co., Ltd. (002907SZ).
- Integrated Data: Historical and projected data provide a solid foundation for analysis.
- High-Quality Standards: Perfect for financial analysts, investors, and business consultants looking to assess Chongqing Pharscin Pharmaceutical Co., Ltd. (002907SZ).
Who Can Benefit from This Product?
- Healthcare Investors: Develop comprehensive and trustworthy valuation models for analyzing pharmaceutical portfolios.
- Corporate Finance Departments: Examine valuation scenarios to inform strategic decisions within the company.
- Consultants and Financial Advisors: Deliver precise valuation insights for stocks like Chongqing Pharscin Pharmaceutical Co., Ltd. (002907SZ).
- Students and Academic Professionals: Utilize real-world data to enhance learning and practice in financial modeling.
- Pharmaceutical Enthusiasts: Gain insights into how pharmaceutical companies, including Chongqing Pharscin Pharmaceutical Co., Ltd. (002907SZ), are appraised in the marketplace.
Contents of the Template
- Pre-Filled Data: Contains Chongqing Pharscin Pharmaceutical Co., Ltd.'s historical financial performance and projections.
- Discounted Cash Flow Model: An editable DCF valuation model featuring automatic calculations.
- Weighted Average Cost of Capital (WACC): A dedicated worksheet for WACC calculations based on user-defined inputs.
- Key Financial Ratios: Evaluate Chongqing Pharscin's profitability, efficiency, and leverage metrics.
- Customizable Inputs: Effortlessly adjust revenue growth, profit margins, and tax rates.
- User-Friendly Dashboard: Visuals and tables presenting essential valuation outcomes.
Disclaimer
All information, articles, and product details provided on this website are for general informational and educational purposes only. We do not claim any ownership over, nor do we intend to infringe upon, any trademarks, copyrights, logos, brand names, or other intellectual property mentioned or depicted on this site. Such intellectual property remains the property of its respective owners, and any references here are made solely for identification or informational purposes, without implying any affiliation, endorsement, or partnership.
We make no representations or warranties, express or implied, regarding the accuracy, completeness, or suitability of any content or products presented. Nothing on this website should be construed as legal, tax, investment, financial, medical, or other professional advice. In addition, no part of this site—including articles or product references—constitutes a solicitation, recommendation, endorsement, advertisement, or offer to buy or sell any securities, franchises, or other financial instruments, particularly in jurisdictions where such activity would be unlawful.
All content is of a general nature and may not address the specific circumstances of any individual or entity. It is not a substitute for professional advice or services. Any actions you take based on the information provided here are strictly at your own risk. You accept full responsibility for any decisions or outcomes arising from your use of this website and agree to release us from any liability in connection with your use of, or reliance upon, the content or products found herein.