
|
Foran Energy Group Co. ، Ltd. (002911.SZ) تقييم DCF |
Fully Editable: Tailor To Your Needs In Excel Or Sheets
Professional Design: Trusted, Industry-Standard Templates
Investor-Approved Valuation Models
MAC/PC Compatible, Fully Unlocked
No Expertise Is Needed; Easy To Follow
Foran Energy Group Co.,Ltd. (002911.SZ) Bundle
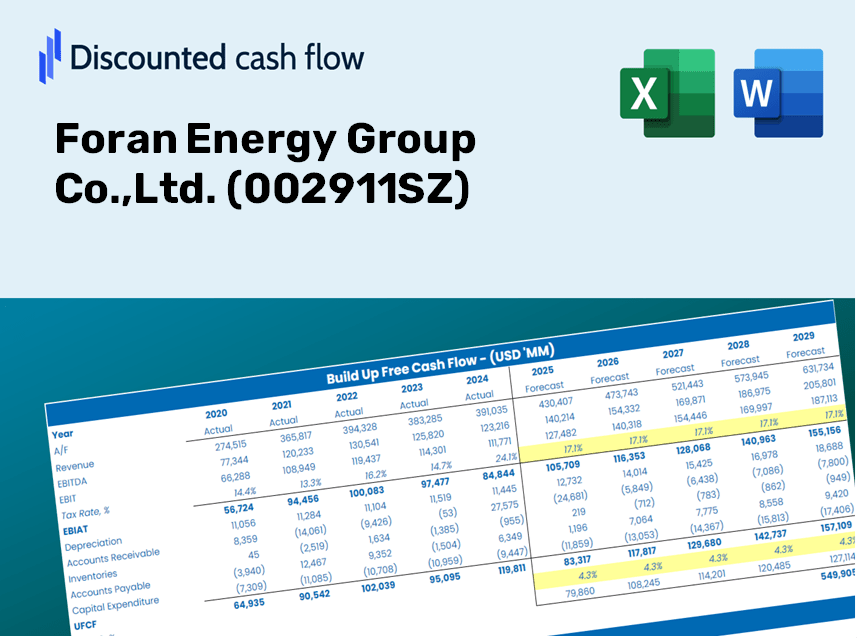
Designed for accuracy, our [002911SZ] DCF Calculator enables you to evaluate Foran Energy Group Co., Ltd. valuation using real-world financial data while providing complete flexibility to modify all key parameters for improved projections.
Discounted Cash Flow (DCF) - (USD MM)
| Year | AY1 2020 |
AY2 2021 |
AY3 2022 |
AY4 2023 |
AY5 2024 |
FY1 2025 |
FY2 2026 |
FY3 2027 |
FY4 2028 |
FY5 2029 |
|---|---|---|---|---|---|---|---|---|---|---|
| Revenue | 7,571.6 | 13,531.2 | 18,923.1 | 25,538.0 | 31,589.5 | 45,584.4 | 65,779.5 | 94,921.6 | 136,974.3 | 197,657.6 |
| Revenue Growth, % | 0 | 78.71 | 39.85 | 34.96 | 23.7 | 44.3 | 44.3 | 44.3 | 44.3 | 44.3 |
| EBITDA | 937.7 | 1,197.2 | 1,507.2 | 1,575.3 | 1,535.2 | 3,667.3 | 5,292.0 | 7,636.6 | 11,019.8 | 15,901.8 |
| EBITDA, % | 12.38 | 8.85 | 7.96 | 6.17 | 4.86 | 8.05 | 8.05 | 8.05 | 8.05 | 8.05 |
| Depreciation | 219.6 | 279.8 | 397.3 | 439.3 | 462.2 | 934.5 | 1,348.5 | 1,945.9 | 2,808.0 | 4,052.0 |
| Depreciation, % | 2.9 | 2.07 | 2.1 | 1.72 | 1.46 | 2.05 | 2.05 | 2.05 | 2.05 | 2.05 |
| EBIT | 718.1 | 917.4 | 1,109.9 | 1,136.0 | 1,073.0 | 2,732.8 | 3,943.5 | 5,690.6 | 8,211.7 | 11,849.8 |
| EBIT, % | 9.48 | 6.78 | 5.87 | 4.45 | 3.4 | 6 | 6 | 6 | 6 | 6 |
| Total Cash | 1,419.9 | 1,689.8 | 1,497.3 | 2,251.3 | 2,788.9 | 5,178.1 | 7,472.2 | 10,782.6 | 15,559.6 | 22,452.9 |
| Total Cash, percent | .0 | .0 | .0 | .0 | .0 | .0 | .0 | .0 | .0 | .0 |
| Account Receivables | 868.3 | 876.2 | 781.8 | 925.8 | 1,591.7 | 2,802.5 | 4,044.0 | 5,835.6 | 8,421.0 | 12,151.7 |
| Account Receivables, % | 11.47 | 6.48 | 4.13 | 3.63 | 5.04 | 6.15 | 6.15 | 6.15 | 6.15 | 6.15 |
| Inventories | 112.7 | 283.8 | 639.3 | 852.1 | 968.8 | 1,218.7 | 1,758.6 | 2,537.7 | 3,662.0 | 5,284.3 |
| Inventories, % | 1.49 | 2.1 | 3.38 | 3.34 | 3.07 | 2.67 | 2.67 | 2.67 | 2.67 | 2.67 |
| Accounts Payable | 814.3 | 1,518.1 | 1,702.9 | 1,950.4 | 2,248.9 | 4,169.1 | 6,016.1 | 8,681.4 | 12,527.6 | 18,077.6 |
| Accounts Payable, % | 10.75 | 11.22 | 9 | 7.64 | 7.12 | 9.15 | 9.15 | 9.15 | 9.15 | 9.15 |
| Capital Expenditure | -926.9 | -1,279.4 | -1,019.7 | -821.7 | -658.6 | -2,952.8 | -4,260.9 | -6,148.6 | -8,872.6 | -12,803.5 |
| Capital Expenditure, % | -12.24 | -9.46 | -5.39 | -3.22 | -2.08 | -6.48 | -6.48 | -6.48 | -6.48 | -6.48 |
| Tax Rate, % | 30.87 | 30.87 | 30.87 | 30.87 | 30.87 | 30.87 | 30.87 | 30.87 | 30.87 | 30.87 |
| EBITAT | 461.1 | 641.3 | 813.7 | 708.7 | 741.8 | 1,852.5 | 2,673.2 | 3,857.6 | 5,566.5 | 8,032.7 |
| Depreciation | ||||||||||
| Changes in Account Receivables | ||||||||||
| Changes in Inventories | ||||||||||
| Changes in Accounts Payable | ||||||||||
| Capital Expenditure | ||||||||||
| UFCF | -412.9 | 166.4 | 115.0 | 217.0 | 61.2 | 293.8 | -173.6 | -250.6 | -361.6 | -521.8 |
| WACC, % | 6.18 | 6.22 | 6.24 | 6.17 | 6.21 | 6.2 | 6.2 | 6.2 | 6.2 | 6.2 |
| PV UFCF | ||||||||||
| SUM PV UFCF | -756.9 | |||||||||
| Long Term Growth Rate, % | 3.50 | |||||||||
| Free cash flow (T + 1) | -540 | |||||||||
| Terminal Value | -19,986 | |||||||||
| Present Terminal Value | -14,793 | |||||||||
| Enterprise Value | -15,550 | |||||||||
| Net Debt | -353 | |||||||||
| Equity Value | -15,198 | |||||||||
| Diluted Shares Outstanding, MM | 1,446 | |||||||||
| Equity Value Per Share | -10.51 |
What You Will Receive
- Real Foran Energy Financials: Access to both historical and projected data for precise valuation.
- Customizable Inputs: Adjust WACC, tax rates, revenue growth, and capital expenditures as needed.
- Automated Calculations: Intrinsic value and NPV are computed in real-time.
- Scenario Analysis: Evaluate various scenarios to assess Foran Energy’s future performance.
- User-Friendly Design: Designed for industry professionals while remaining approachable for newcomers.
Core Features
- Accurate Financial Data: Gain access to reliable pre-loaded historical figures and future forecasts for Foran Energy Group Co., Ltd. (002911SZ).
- Adjustable Forecast Parameters: Modify the highlighted fields such as WACC, growth rates, and profit margins to fit your analysis.
- Real-Time Calculations: Enjoy automatic updates for DCF, Net Present Value (NPV), and cash flow assessments.
- User-Friendly Dashboard: View intuitive charts and summaries to easily interpret your valuation outcomes.
- Designed for All Experience Levels: An easy-to-navigate format tailored for investors, CFOs, and consultants alike.
How It Works
- Step 1: Download the Excel file.
- Step 2: Review Foran Energy Group Co., Ltd.'s (002911SZ) pre-filled financial data and forecasts.
- Step 3: Adjust key inputs such as revenue growth, WACC, and tax rates (highlighted cells).
- Step 4: Observe the DCF model update in real-time as you modify assumptions.
- Step 5: Evaluate the outputs and leverage the results for your investment strategies.
Why Choose This Calculator for Foran Energy Group Co., Ltd. (002911SZ)?
- User-Friendly Interface: Tailored for both novices and seasoned professionals.
- Customizable Inputs: Adjust parameters easily to suit your analysis needs.
- Immediate Feedback: Watch real-time updates on Foran Energy's valuation as you change inputs.
- Preloaded Data: Comes equipped with Foran Energy's latest financial information for swift assessments.
- Endorsed by Experts: Utilized by investors and analysts for making well-informed decisions.
Who Should Utilize This Product?
- Institutional Investors: Develop comprehensive and accurate valuation models for portfolio evaluations with Foran Energy Group Co.,Ltd. (002911SZ).
- Corporate Finance Departments: Examine valuation scenarios to inform strategic decisions within your organization.
- Consultants and Financial Advisors: Equip clients with precise valuation insights specifically for Foran Energy Group Co.,Ltd. (002911SZ).
- Students and Academic Professionals: Leverage real-time data to enhance financial modeling practices and education.
- Energy Sector Enthusiasts: Gain a deeper understanding of how companies like Foran Energy Group Co.,Ltd. (002911SZ) are valued in the marketplace.
Contents of the Template
- Preloaded Foran Energy Data: Historical and projected financial figures, including revenue, EBIT, and capital expenditures.
- DCF and WACC Models: Professional-grade worksheets for calculating intrinsic value and Weighted Average Cost of Capital.
- Editable Inputs: Yellow-highlighted cells for customizing revenue growth, tax rates, and discount rates.
- Financial Statements: Detailed annual and quarterly financial reports for in-depth analysis.
- Key Ratios: Metrics on profitability, leverage, and efficiency to assess performance.
- Dashboard and Charts: Visual representations of valuation outcomes and underlying assumptions.
Disclaimer
All information, articles, and product details provided on this website are for general informational and educational purposes only. We do not claim any ownership over, nor do we intend to infringe upon, any trademarks, copyrights, logos, brand names, or other intellectual property mentioned or depicted on this site. Such intellectual property remains the property of its respective owners, and any references here are made solely for identification or informational purposes, without implying any affiliation, endorsement, or partnership.
We make no representations or warranties, express or implied, regarding the accuracy, completeness, or suitability of any content or products presented. Nothing on this website should be construed as legal, tax, investment, financial, medical, or other professional advice. In addition, no part of this site—including articles or product references—constitutes a solicitation, recommendation, endorsement, advertisement, or offer to buy or sell any securities, franchises, or other financial instruments, particularly in jurisdictions where such activity would be unlawful.
All content is of a general nature and may not address the specific circumstances of any individual or entity. It is not a substitute for professional advice or services. Any actions you take based on the information provided here are strictly at your own risk. You accept full responsibility for any decisions or outcomes arising from your use of this website and agree to release us from any liability in connection with your use of, or reliance upon, the content or products found herein.