
|
New Hope Dairy Co. ، Ltd. (002946.SZ) تقييم DCF |
Fully Editable: Tailor To Your Needs In Excel Or Sheets
Professional Design: Trusted, Industry-Standard Templates
Investor-Approved Valuation Models
MAC/PC Compatible, Fully Unlocked
No Expertise Is Needed; Easy To Follow
New Hope Dairy Co., Ltd. (002946.SZ) Bundle
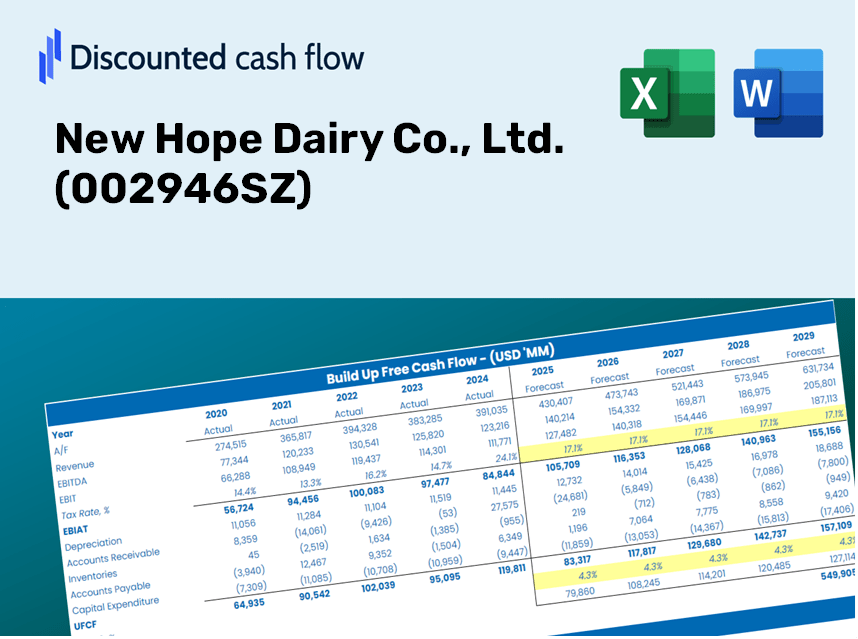
Discover the real worth of New Hope Dairy Co., Ltd. (002946SZ) with our advanced DCF Calculator! Adjust essential assumptions, explore various scenarios, and evaluate how changes affect New Hope Dairy Co., Ltd. (002946SZ) valuation – all within one convenient Excel template.
What You Will Receive
- Authentic NHDC Financial Data: Pre-populated with New Hope Dairy’s historical and projected figures for accurate analysis.
- Completely Customizable Template: Easily adjust key metrics such as revenue growth, WACC, and EBITDA %.
- Instant Calculations: Observe the intrinsic value of New Hope Dairy update in real-time as you modify inputs.
- Professional Valuation Resource: Ideal for investors, analysts, and consultants aiming for reliable DCF outcomes.
- User-Friendly Interface: Intuitive layout and straightforward instructions suitable for all skill levels.
Key Features
- Accurate Dairy Financials: Gain access to precise pre-loaded historical data and forward-looking forecasts for New Hope Dairy Co., Ltd. (002946SZ).
- Flexible Forecast Inputs: Modify the highlighted yellow cells to adjust key assumptions like WACC, growth rates, and profit margins.
- Real-Time Calculations: Automatic refresh of DCF, Net Present Value (NPV), and cash flow analyses for up-to-date insights.
- Interactive Visual Dashboard: User-friendly charts and summaries that help you visualize your valuation findings.
- Suitable for All Skill Levels: An intuitive design crafted for investors, CFOs, and consultants, from novices to experts.
How It Works
- Download: Obtain the pre-built Excel file featuring New Hope Dairy Co., Ltd. (002946SZ) financial data.
- Customize: Tailor your forecasts, including revenue growth, EBITDA %, and WACC.
- Update Automatically: Monitor real-time updates for intrinsic value and NPV calculations.
- Test Scenarios: Generate various projections and assess outcomes in an instant.
- Make Decisions: Leverage the valuation insights to inform your investment strategies.
Why Choose New Hope Dairy's Financial Calculator?
- Save Time: Skip the hassle of building a DCF model from scratch – it's readily available for use.
- Enhance Accuracy: Dependable financial data and formulas minimize valuation errors.
- Completely Customizable: Adjust the model to match your specific assumptions and forecasts.
- Intuitive Design: User-friendly charts and outputs simplify result interpretation.
- Endorsed by Professionals: Crafted for experts who prioritize accuracy and ease of use.
Who Should Consider New Hope Dairy Co., Ltd.?
- Individual Investors: Gain insights to make educated decisions about buying or selling shares of New Hope Dairy Co., Ltd. (002946SZ).
- Financial Analysts: Enhance valuation methodologies with practical financial models tailored for New Hope Dairy Co., Ltd. (002946SZ).
- Consultants: Provide swift and accurate valuation assessments for your clients based on New Hope Dairy Co., Ltd. (002946SZ).
- Business Owners: Learn from the valuation approaches of major corporations like New Hope Dairy Co., Ltd. (002946SZ) to inform your own business strategies.
- Finance Students: Explore valuation principles utilizing real-world data and case studies from New Hope Dairy Co., Ltd. (002946SZ).
Contents of the Template
- Preloaded NHDC Data: Historical and projected financial metrics, including revenue, EBIT, and capital expenditures.
- DCF and WACC Models: Advanced sheets designed for calculating intrinsic value and Weighted Average Cost of Capital.
- Editable Inputs: Yellow-highlighted cells for customizable revenue growth, tax rates, and discount rates.
- Financial Statements: Detailed annual and quarterly financial reports for in-depth analysis.
- Key Ratios: Profitability, leverage, and efficiency ratios to assess performance.
- Dashboard and Charts: Visual representations of valuation results and underlying assumptions.
Disclaimer
All information, articles, and product details provided on this website are for general informational and educational purposes only. We do not claim any ownership over, nor do we intend to infringe upon, any trademarks, copyrights, logos, brand names, or other intellectual property mentioned or depicted on this site. Such intellectual property remains the property of its respective owners, and any references here are made solely for identification or informational purposes, without implying any affiliation, endorsement, or partnership.
We make no representations or warranties, express or implied, regarding the accuracy, completeness, or suitability of any content or products presented. Nothing on this website should be construed as legal, tax, investment, financial, medical, or other professional advice. In addition, no part of this site—including articles or product references—constitutes a solicitation, recommendation, endorsement, advertisement, or offer to buy or sell any securities, franchises, or other financial instruments, particularly in jurisdictions where such activity would be unlawful.
All content is of a general nature and may not address the specific circumstances of any individual or entity. It is not a substitute for professional advice or services. Any actions you take based on the information provided here are strictly at your own risk. You accept full responsibility for any decisions or outcomes arising from your use of this website and agree to release us from any liability in connection with your use of, or reliance upon, the content or products found herein.