
|
شركة Dongguan Aohai Technology Co.، Ltd. (002993.SZ) تقييم DCF |
Fully Editable: Tailor To Your Needs In Excel Or Sheets
Professional Design: Trusted, Industry-Standard Templates
Investor-Approved Valuation Models
MAC/PC Compatible, Fully Unlocked
No Expertise Is Needed; Easy To Follow
Dongguan Aohai Technology Co., Ltd. (002993.SZ) Bundle
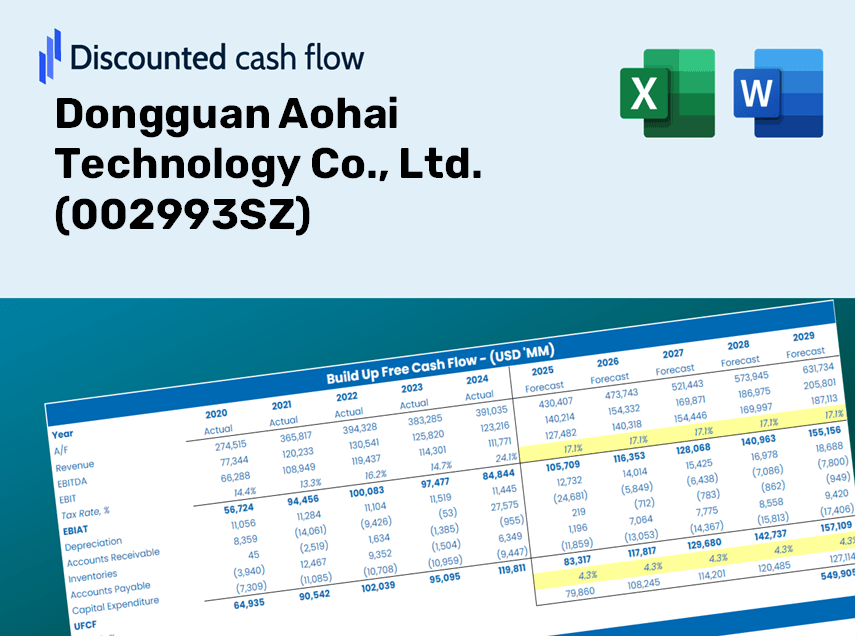
Gain insights into your Dongguan Aohai Technology Co., Ltd. (002993SZ) valuation analysis with our state-of-the-art DCF Calculator! This Excel template is preloaded with real (002993SZ) data, enabling you to adjust forecasts and assumptions to determine the intrinsic value of Dongguan Aohai Technology Co., Ltd. with accuracy.
Discounted Cash Flow (DCF) - (USD MM)
| Year | AY1 2020 |
AY2 2021 |
AY3 2022 |
AY4 2023 |
AY5 2024 |
FY1 2025 |
FY2 2026 |
FY3 2027 |
FY4 2028 |
FY5 2029 |
|---|---|---|---|---|---|---|---|---|---|---|
| Revenue | 2,945.2 | 4,245.3 | 4,466.8 | 5,174.3 | 6,423.2 | 7,186.9 | 8,041.3 | 8,997.4 | 10,067.2 | 11,264.1 |
| Revenue Growth, % | 0 | 44.14 | 5.22 | 15.84 | 24.14 | 11.89 | 11.89 | 11.89 | 11.89 | 11.89 |
| EBITDA | 415.5 | 386.9 | 525.9 | 521.8 | 597.9 | 781.8 | 874.7 | 978.7 | 1,095.1 | 1,225.3 |
| EBITDA, % | 14.11 | 9.11 | 11.77 | 10.08 | 9.31 | 10.88 | 10.88 | 10.88 | 10.88 | 10.88 |
| Depreciation | 34.6 | 61.2 | 100.7 | 131.0 | 183.0 | 147.4 | 164.9 | 184.5 | 206.4 | 231.0 |
| Depreciation, % | 1.18 | 1.44 | 2.25 | 2.53 | 2.85 | 2.05 | 2.05 | 2.05 | 2.05 | 2.05 |
| EBIT | 380.9 | 325.7 | 425.2 | 390.8 | 414.9 | 634.4 | 709.8 | 794.2 | 888.6 | 994.3 |
| EBIT, % | 12.93 | 7.67 | 9.52 | 7.55 | 6.46 | 8.83 | 8.83 | 8.83 | 8.83 | 8.83 |
| Total Cash | 2,041.9 | 1,713.3 | 3,040.8 | 3,121.5 | 3,273.9 | 4,154.9 | 4,648.9 | 5,201.6 | 5,820.1 | 6,512.1 |
| Total Cash, percent | .0 | .0 | .0 | .0 | .0 | .0 | .0 | .0 | .0 | .0 |
| Account Receivables | 1,104.9 | 1,474.1 | 1,229.3 | 1,832.3 | 2,220.3 | 2,439.8 | 2,729.9 | 3,054.4 | 3,417.6 | 3,823.9 |
| Account Receivables, % | 37.52 | 34.72 | 27.52 | 35.41 | 34.57 | 33.95 | 33.95 | 33.95 | 33.95 | 33.95 |
| Inventories | 356.4 | 661.3 | 532.9 | 779.7 | 839.8 | 973.8 | 1,089.6 | 1,219.1 | 1,364.1 | 1,526.3 |
| Inventories, % | 12.1 | 15.58 | 11.93 | 15.07 | 13.07 | 13.55 | 13.55 | 13.55 | 13.55 | 13.55 |
| Accounts Payable | 1,803.9 | 2,290.7 | 1,924.1 | 2,939.3 | 3,142.2 | 3,794.8 | 4,246.0 | 4,750.9 | 5,315.7 | 5,947.7 |
| Accounts Payable, % | 61.25 | 53.96 | 43.08 | 56.81 | 48.92 | 52.8 | 52.8 | 52.8 | 52.8 | 52.8 |
| Capital Expenditure | -263.7 | -529.5 | -375.2 | -404.6 | -580.1 | -670.9 | -750.7 | -839.9 | -939.8 | -1,051.6 |
| Capital Expenditure, % | -8.95 | -12.47 | -8.4 | -7.82 | -9.03 | -9.34 | -9.34 | -9.34 | -9.34 | -9.34 |
| Tax Rate, % | 14.85 | 14.85 | 14.85 | 14.85 | 14.85 | 14.85 | 14.85 | 14.85 | 14.85 | 14.85 |
| EBITAT | 335.2 | 292.4 | 376.0 | 348.2 | 353.3 | 558.9 | 625.3 | 699.6 | 782.8 | 875.9 |
| Depreciation | ||||||||||
| Changes in Account Receivables | ||||||||||
| Changes in Inventories | ||||||||||
| Changes in Accounts Payable | ||||||||||
| Capital Expenditure | ||||||||||
| UFCF | 448.7 | -363.2 | 108.1 | 240.0 | -289.1 | 334.4 | 84.8 | 94.9 | 106.2 | 118.8 |
| WACC, % | 4.51 | 4.51 | 4.51 | 4.51 | 4.51 | 4.51 | 4.51 | 4.51 | 4.51 | 4.51 |
| PV UFCF | ||||||||||
| SUM PV UFCF | 665.1 | |||||||||
| Long Term Growth Rate, % | 3.50 | |||||||||
| Free cash flow (T + 1) | 123 | |||||||||
| Terminal Value | 12,188 | |||||||||
| Present Terminal Value | 9,776 | |||||||||
| Enterprise Value | 10,441 | |||||||||
| Net Debt | -1,608 | |||||||||
| Equity Value | 12,049 | |||||||||
| Diluted Shares Outstanding, MM | 277 | |||||||||
| Equity Value Per Share | 43.54 |
What You Will Receive
- Authentic Dongguan Aohai Data: Comprehensive financials – from revenue to EBIT – utilizing both actual and projected metrics.
- Complete Customization: Modify all essential parameters (yellow cells) such as WACC, growth %, and tax rates.
- Immediate Valuation Adjustments: Automatic recalculations to assess the effects of changes on Dongguan Aohai's fair value.
- Flexible Excel Template: Designed for quick modifications, scenario analysis, and thorough forecasting.
- Efficient and Precise: Eliminate the need to build models from the ground up while ensuring accuracy and adaptability.
Key Features
- Real-Time Financial Data for Aohai Technology: Pre-loaded with Dongguan Aohai's historical financials and future projections.
- Customizable Parameters: Modify revenue growth, profit margins, WACC, tax rates, and capital expenditures to suit your analysis.
- Interactive Valuation Model: Automatically recalculates Net Present Value (NPV) and intrinsic value based on your adjusted inputs.
- Flexible Scenario Analysis: Develop various forecasting scenarios to explore different valuation results.
- Intuitive User Interface: Designed for ease of use, making it accessible for both seasoned professionals and newcomers.
How It Operates
- Download: Obtain the pre-formatted Excel file featuring Dongguan Aohai Technology Co., Ltd.'s financial data.
- Customize: Modify projections such as revenue growth, EBITDA %, and WACC as needed.
- Update Automatically: The intrinsic value and NPV calculations refresh in real-time for accuracy.
- Test Scenarios: Generate various forecasts and instantly compare the results.
- Make Decisions: Leverage the valuation insights to inform your investment strategy for (002993SZ).
Why Opt for Aohai Technology Calculator?
- Reliable Data: Access the latest financial information from Dongguan Aohai Technology Co., Ltd. for trustworthy valuation outcomes.
- Flexible Customization: Tailor key metrics such as growth rates, WACC, and tax rates to align with your forecasts.
- Efficiency Boost: Built-in calculations save you time by removing the need to start from the ground up.
- Professional Quality: Aimed at investors, analysts, and consultants seeking top-tier tools.
- User-Friendly Design: Easy-to-navigate interface and guided instructions ensure accessibility for all users.
Who Can Benefit from This Product?
- Institutional Investors: Create comprehensive and accurate valuation models for evaluating investments in Dongguan Aohai Technology Co., Ltd. (002993SZ).
- Finance Departments: Examine valuation scenarios to inform strategic decision-making within the organization.
- Advisors and Consultants: Deliver precise valuation analyses to clients considering investments in Dongguan Aohai Technology Co., Ltd. (002993SZ).
- Students and Educators: Leverage real market data to enhance financial modeling skills and knowledge.
- Technology Analysts: Gain insights into the market valuation of tech firms like Dongguan Aohai Technology Co., Ltd. (002993SZ).
Overview of the Template Contents
- Detailed DCF Model: An editable template featuring intricate valuation calculations.
- Real-World Financial Data: Historical and forecasted financials for Dongguan Aohai Technology Co., Ltd. (002993SZ) preloaded for in-depth analysis.
- Adjustable Assumptions: Modify WACC, growth rates, and tax assumptions to explore different scenarios.
- Comprehensive Financial Statements: Complete annual and quarterly breakdowns providing deeper insights.
- Essential Ratios: Integrated analysis covering profitability, efficiency, and leverage metrics.
- Interactive Dashboard with Visual Outputs: Visualizations including charts and tables for clear, actionable insights.
Disclaimer
All information, articles, and product details provided on this website are for general informational and educational purposes only. We do not claim any ownership over, nor do we intend to infringe upon, any trademarks, copyrights, logos, brand names, or other intellectual property mentioned or depicted on this site. Such intellectual property remains the property of its respective owners, and any references here are made solely for identification or informational purposes, without implying any affiliation, endorsement, or partnership.
We make no representations or warranties, express or implied, regarding the accuracy, completeness, or suitability of any content or products presented. Nothing on this website should be construed as legal, tax, investment, financial, medical, or other professional advice. In addition, no part of this site—including articles or product references—constitutes a solicitation, recommendation, endorsement, advertisement, or offer to buy or sell any securities, franchises, or other financial instruments, particularly in jurisdictions where such activity would be unlawful.
All content is of a general nature and may not address the specific circumstances of any individual or entity. It is not a substitute for professional advice or services. Any actions you take based on the information provided here are strictly at your own risk. You accept full responsibility for any decisions or outcomes arising from your use of this website and agree to release us from any liability in connection with your use of, or reliance upon, the content or products found herein.