
|
شركة Jinzai Food Group Co.، Ltd. (003000.SZ) تقييم DCF |
Fully Editable: Tailor To Your Needs In Excel Or Sheets
Professional Design: Trusted, Industry-Standard Templates
Investor-Approved Valuation Models
MAC/PC Compatible, Fully Unlocked
No Expertise Is Needed; Easy To Follow
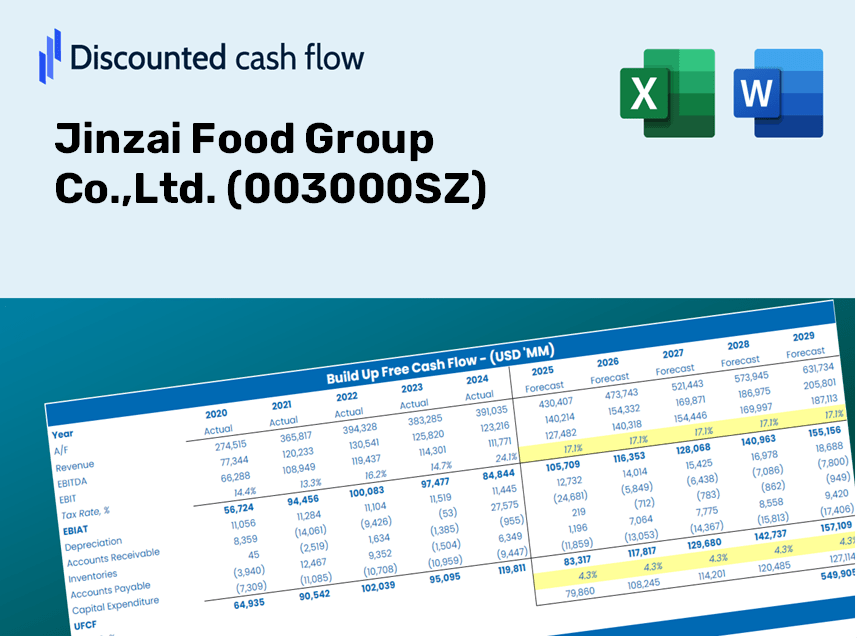
Jinzai Food Group Co.,Ltd. (003000.SZ) Bundle
Simplify Jinzai Food Group Co., Ltd. (003000SZ) valuation with this customizable DCF Calculator! Featuring real Jinzai Food Group Co., Ltd. (003000SZ) financials and adjustable forecast inputs, you can test scenarios and uncover Jinzai Food Group Co., Ltd. (003000SZ) fair value in minutes.
What You Will Receive
- Adjustable Forecast Parameters: Quickly modify key assumptions (growth %, margins, WACC) to explore various scenarios.
- Real-Time Financial Data: Jinzai Food Group Co.,Ltd.'s financial information is pre-loaded to facilitate your analysis.
- Automated DCF Calculations: The template provides instant calculations for Net Present Value (NPV) and intrinsic value.
- Tailored and Professional: A sleek Excel model that can be customized to meet your valuation requirements.
- Designed for Analysts and Investors: Perfect for evaluating projections, confirming strategies, and enhancing efficiency.
Essential Features
- Accurate Jinzai Food Financials: Gain access to reliable historical data and future forecasts.
- Adjustable Forecast Parameters: Modify highlighted cells for key metrics such as WACC, growth percentages, and profit margins.
- Real-Time Calculations: Experience automatic updates for DCF, Net Present Value (NPV), and cash flow assessments.
- Interactive Visual Dashboard: Utilize user-friendly charts and summaries to easily interpret your valuation findings.
- Designed for All Skill Levels: An intuitive layout crafted for investors, CFOs, and consultants alike.
How It Operates
- Download the Template: Gain immediate access to the Excel-based Jinzai Food Group DCF Calculator.
- Input Your Assumptions: Modify the yellow-highlighted cells for growth rates, WACC, margins, and other parameters.
- Instant Calculations: The model automatically recalculates the intrinsic value of Jinzai Food Group (003000SZ).
- Test Scenarios: Explore various assumptions to assess potential changes in valuation.
- Analyze and Decide: Utilize the results to inform your investment or financial decisions.
Why Select This Calculator?
- Designed for Experts: A sophisticated tool utilized by industry analysts, CFOs, and consultants.
- Accurate Data: Jinzai Food Group’s (003000SZ) historical and projected financials are preloaded for precision.
- Scenario Analysis: Effortlessly simulate various forecasts and assumptions.
- Comprehensive Outputs: Automatically computes intrinsic value, NPV, and essential metrics.
- User-Friendly: Step-by-step guidance simplifies the entire process.
Who Can Benefit from Jinzai Food Group Co., Ltd. (003000SZ)?
- Investors: Enhance your investment strategy with insights from a top-tier food industry analysis tool.
- Financial Analysts: Streamline your workflow with a customizable financial model specifically designed for the food sector.
- Consultants: Effortlessly tailor reports and presentations for your clients in the food and beverage industry.
- Food Industry Enthusiasts: Expand your knowledge of market trends and valuation methodologies through real-life case studies.
- Educators and Students: Utilize this resource as a hands-on educational tool in courses focused on finance and the food market.
What the Template Includes
- Pre-Filled DCF Model: Jinzai Food Group’s financial data ready for immediate application.
- WACC Calculator: Comprehensive calculations for Weighted Average Cost of Capital.
- Financial Ratios: Analyze Jinzai’s profitability, leverage, and operational efficiency.
- Editable Inputs: Modify assumptions like growth rates, margins, and CAPEX to match your scenarios.
- Financial Statements: Annual and quarterly reports for in-depth analysis.
- Interactive Dashboard: Effortlessly visualize crucial valuation metrics and outcomes.
Disclaimer
All information, articles, and product details provided on this website are for general informational and educational purposes only. We do not claim any ownership over, nor do we intend to infringe upon, any trademarks, copyrights, logos, brand names, or other intellectual property mentioned or depicted on this site. Such intellectual property remains the property of its respective owners, and any references here are made solely for identification or informational purposes, without implying any affiliation, endorsement, or partnership.
We make no representations or warranties, express or implied, regarding the accuracy, completeness, or suitability of any content or products presented. Nothing on this website should be construed as legal, tax, investment, financial, medical, or other professional advice. In addition, no part of this site—including articles or product references—constitutes a solicitation, recommendation, endorsement, advertisement, or offer to buy or sell any securities, franchises, or other financial instruments, particularly in jurisdictions where such activity would be unlawful.
All content is of a general nature and may not address the specific circumstances of any individual or entity. It is not a substitute for professional advice or services. Any actions you take based on the information provided here are strictly at your own risk. You accept full responsibility for any decisions or outcomes arising from your use of this website and agree to release us from any liability in connection with your use of, or reliance upon, the content or products found herein.