
|
مجموعة Fortune Financial Group Limited (0290.HK) تقييم DCF |
Fully Editable: Tailor To Your Needs In Excel Or Sheets
Professional Design: Trusted, Industry-Standard Templates
Investor-Approved Valuation Models
MAC/PC Compatible, Fully Unlocked
No Expertise Is Needed; Easy To Follow
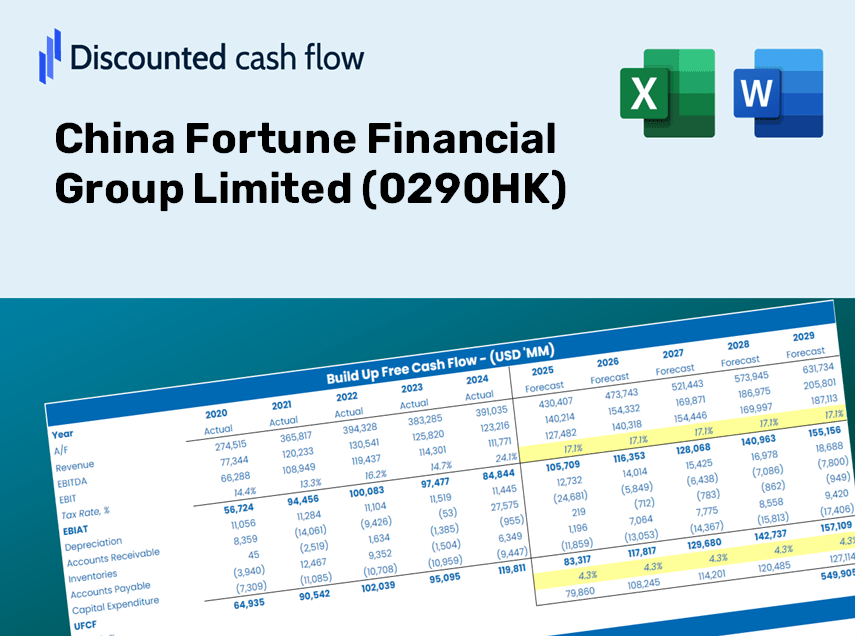
China Fortune Financial Group Limited (0290.HK) Bundle
Enhance your investment choices with the (0290HK) DCF Calculator! Explore authentic financial data for China Fortune Financial Group Limited, adjust growth predictions and expenses, and observe how these modifications affect the intrinsic value of (0290HK) in real-time.
Discounted Cash Flow (DCF) - (USD MM)
| Year | AY1 2020 |
AY2 2021 |
AY3 2022 |
AY4 2023 |
AY5 2024 |
FY1 2025 |
FY2 2026 |
FY3 2027 |
FY4 2028 |
FY5 2029 |
|---|---|---|---|---|---|---|---|---|---|---|
| Revenue | 156.9 | 57.5 | 24.4 | 46.0 | 863.4 | 1,009.3 | 1,180.0 | 1,379.4 | 1,612.6 | 1,885.2 |
| Revenue Growth, % | 0 | -63.36 | -57.58 | 88.55 | 1777.98 | 16.9 | 16.9 | 16.9 | 16.9 | 16.9 |
| EBITDA | 41.4 | -40.6 | -49.8 | -28.4 | 10.1 | -413.7 | -483.6 | -565.3 | -660.9 | -772.6 |
| EBITDA, % | 26.4 | -70.68 | -204.35 | -61.82 | 1.18 | -40.98 | -40.98 | -40.98 | -40.98 | -40.98 |
| Depreciation | 22.0 | 9.6 | 57.4 | 1.9 | 8.8 | 274.3 | 320.7 | 374.9 | 438.3 | 512.4 |
| Depreciation, % | 14.02 | 16.75 | 235.46 | 4.11 | 1.02 | 27.18 | 27.18 | 27.18 | 27.18 | 27.18 |
| EBIT | 19.4 | -50.3 | -107.2 | -30.3 | 1.3 | -486.1 | -568.3 | -664.4 | -776.7 | -907.9 |
| EBIT, % | 12.39 | -87.43 | -439.81 | -65.92 | 0.15115 | -48.16 | -48.16 | -48.16 | -48.16 | -48.16 |
| Total Cash | 363.9 | 195.8 | 183.2 | 462.8 | 392.8 | 899.3 | 1,051.3 | 1,229.0 | 1,436.8 | 1,679.7 |
| Total Cash, percent | .0 | .0 | .0 | .0 | .0 | .0 | .0 | .0 | .0 | .0 |
| Account Receivables | 86.6 | 118.4 | 45.8 | 101.9 | 208.9 | 765.9 | 895.3 | 1,046.7 | 1,223.6 | 1,430.5 |
| Account Receivables, % | 55.2 | 205.91 | 187.63 | 221.54 | 24.2 | 75.88 | 75.88 | 75.88 | 75.88 | 75.88 |
| Inventories | .0 | .0 | .0 | .0 | .0 | .0 | .0 | .0 | .0 | .0 |
| Inventories, % | 0 | 0 | 0 | 0 | 0 | 0 | 0 | 0 | 0 | 0 |
| Accounts Payable | 260.9 | 172.4 | 137.2 | 276.0 | 213.7 | 857.4 | 1,002.4 | 1,171.8 | 1,369.9 | 1,601.5 |
| Accounts Payable, % | 166.34 | 299.86 | 562.51 | 600.38 | 24.75 | 84.95 | 84.95 | 84.95 | 84.95 | 84.95 |
| Capital Expenditure | -4.9 | -.1 | .0 | .0 | -40.5 | -16.2 | -18.9 | -22.1 | -25.8 | -30.2 |
| Capital Expenditure, % | -3.1 | -0.22616 | 0 | 0 | -4.69 | -1.6 | -1.6 | -1.6 | -1.6 | -1.6 |
| Tax Rate, % | -46.29 | -46.29 | -46.29 | -46.29 | -46.29 | -46.29 | -46.29 | -46.29 | -46.29 | -46.29 |
| EBITAT | 34.6 | -50.1 | -105.7 | -30.4 | 1.9 | -484.5 | -566.4 | -662.1 | -774.0 | -904.9 |
| Depreciation | ||||||||||
| Changes in Account Receivables | ||||||||||
| Changes in Inventories | ||||||||||
| Changes in Accounts Payable | ||||||||||
| Capital Expenditure | ||||||||||
| UFCF | 226.0 | -161.0 | -10.9 | 54.3 | -199.1 | -139.5 | -249.1 | -291.2 | -340.4 | -397.9 |
| WACC, % | 4.61 | 4.61 | 4.61 | 4.61 | 4.61 | 4.61 | 4.61 | 4.61 | 4.61 | 4.61 |
| PV UFCF | ||||||||||
| SUM PV UFCF | -1,217.3 | |||||||||
| Long Term Growth Rate, % | 2.00 | |||||||||
| Free cash flow (T + 1) | -406 | |||||||||
| Terminal Value | -15,550 | |||||||||
| Present Terminal Value | -12,413 | |||||||||
| Enterprise Value | -13,630 | |||||||||
| Net Debt | 338 | |||||||||
| Equity Value | -13,968 | |||||||||
| Diluted Shares Outstanding, MM | 3,381 | |||||||||
| Equity Value Per Share | -4.13 |
What You Will Receive
- Authentic Data for China Fortune Financial Group: Comprehensive financials – covering everything from revenue to net profit – sourced from actual and forecasted data.
- Complete Customization: Modify all essential parameters (yellow cells) such as WACC, growth %, and tax rates to suit your analysis.
- Immediate Valuation Revisions: Automatic updates that allow you to assess the effects of changes on the fair value of China Fortune Financial Group (0290HK).
- Flexible Excel Template: Designed for easy modifications, scenario analysis, and in-depth financial forecasting.
- Efficient and Precise: Avoid the hassle of creating models from scratch while ensuring accuracy and adaptability.
Key Features
- Accurate Financial Data for China Fortune Financial Group Limited (0290HK): Access reliable historical figures and future forecasts.
- Customizable Projection Inputs: Modify highlighted yellow cells for variables such as WACC, growth rates, and profit margins.
- Real-Time Calculations: Automatic updates for DCF, Net Present Value (NPV), and cash flow assessments.
- User-Friendly Dashboard: Easy-to-understand charts and summaries to visualize valuation outcomes.
- Designed for All Levels: A straightforward, intuitive layout tailored for investors, CFOs, and financial consultants.
How It Works
- Download the Template: Gain immediate access to the Excel-based China Fortune Financial Group Limited (0290HK) DCF Calculator.
- Input Your Assumptions: Modify the yellow-highlighted cells for growth rates, WACC, margins, and additional parameters.
- Instant Calculations: The model will automatically calculate the intrinsic value of China Fortune Financial Group Limited (0290HK).
- Test Scenarios: Experiment with different assumptions to see how valuations might change.
- Analyze and Decide: Utilize the outcomes to inform your investment strategies or financial assessments.
Why Opt for This Calculator?
- Reliable Data: Access to accurate financials from China Fortune Financial Group Limited (0290HK) guarantees trustworthy valuation outcomes.
- Customizable Features: Modify essential parameters such as growth rates, WACC, and tax rates to align with your forecasts.
- Efficiency Boost: Pre-configured calculations save you the hassle of starting from the ground up.
- Professional-Quality Tool: Tailored for investors, analysts, and consultants.
- User-Centric Design: A straightforward layout and guided instructions ensure accessibility for all users.
Who Can Benefit from This Product?
- Individual Investors: Make informed choices regarding the purchase or sale of China Fortune Financial Group Limited (0290HK) stock.
- Financial Analysts: Enhance your valuation processes with ready-to-apply financial models tailored for China Fortune Financial Group Limited (0290HK).
- Consultants: Provide clients with professional valuation insights for China Fortune Financial Group Limited (0290HK) quickly and accurately.
- Business Owners: Gain a deeper understanding of how large corporations like China Fortune Financial Group Limited (0290HK) are valued to inform your own strategic decisions.
- Finance Students: Master valuation techniques using real-world data and scenarios related to China Fortune Financial Group Limited (0290HK).
Contents of the Template
- Pre-Filled Data: Features historical financials and forecasts for China Fortune Financial Group Limited (0290HK).
- Discounted Cash Flow Model: An editable DCF valuation model with automated calculations included.
- Weighted Average Cost of Capital (WACC): A separate sheet dedicated to calculating WACC with customizable inputs.
- Key Financial Ratios: Evaluate China Fortune’s profitability, efficiency, and leverage metrics.
- Customizable Inputs: Easily modify revenue growth rates, profit margins, and tax rates.
- Clear Dashboard: Visual representations through charts and tables summarizing essential valuation outcomes.
Disclaimer
All information, articles, and product details provided on this website are for general informational and educational purposes only. We do not claim any ownership over, nor do we intend to infringe upon, any trademarks, copyrights, logos, brand names, or other intellectual property mentioned or depicted on this site. Such intellectual property remains the property of its respective owners, and any references here are made solely for identification or informational purposes, without implying any affiliation, endorsement, or partnership.
We make no representations or warranties, express or implied, regarding the accuracy, completeness, or suitability of any content or products presented. Nothing on this website should be construed as legal, tax, investment, financial, medical, or other professional advice. In addition, no part of this site—including articles or product references—constitutes a solicitation, recommendation, endorsement, advertisement, or offer to buy or sell any securities, franchises, or other financial instruments, particularly in jurisdictions where such activity would be unlawful.
All content is of a general nature and may not address the specific circumstances of any individual or entity. It is not a substitute for professional advice or services. Any actions you take based on the information provided here are strictly at your own risk. You accept full responsibility for any decisions or outcomes arising from your use of this website and agree to release us from any liability in connection with your use of, or reliance upon, the content or products found herein.