
|
Sihuan Pharmaceutical Holdings Group Ltd. (0460.HK) تقييم DCF |
Fully Editable: Tailor To Your Needs In Excel Or Sheets
Professional Design: Trusted, Industry-Standard Templates
Investor-Approved Valuation Models
MAC/PC Compatible, Fully Unlocked
No Expertise Is Needed; Easy To Follow
Sihuan Pharmaceutical Holdings Group Ltd. (0460.HK) Bundle
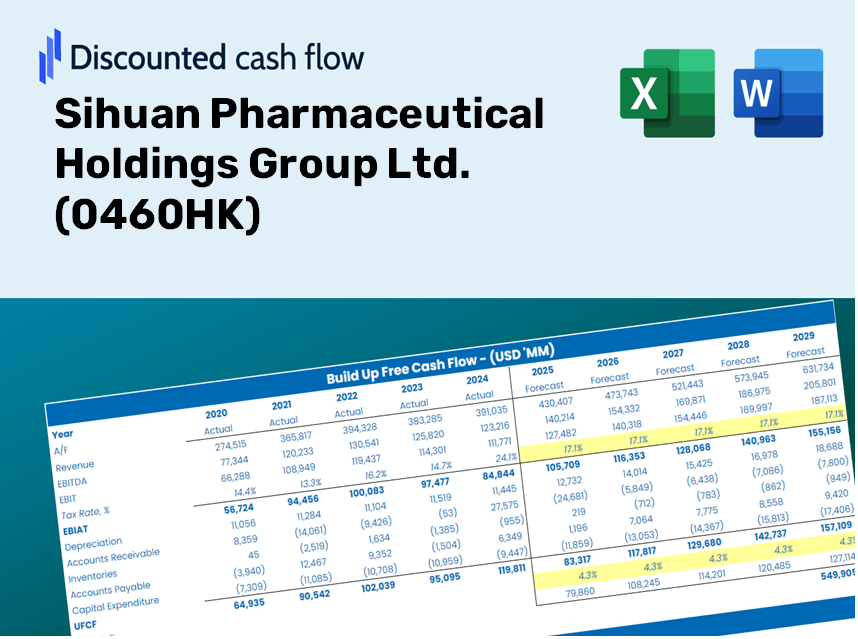
Gain insights into your Sihuan Pharmaceutical Holdings Group Ltd. (0460HK) valuation analysis using our cutting-edge DCF Calculator! This Excel template comes preloaded with real (0460HK) data, enabling you to adjust forecasts and assumptions to accurately compute the intrinsic value of Sihuan Pharmaceutical.
Discounted Cash Flow (DCF) - (USD MM)
| Year | AY1 2020 |
AY2 2021 |
AY3 2022 |
AY4 2023 |
AY5 2024 |
FY1 2025 |
FY2 2026 |
FY3 2027 |
FY4 2028 |
FY5 2029 |
|---|---|---|---|---|---|---|---|---|---|---|
| Revenue | 2,695.8 | 3,323.9 | 2,386.2 | 2,035.4 | 2,079.8 | 1,989.1 | 1,902.4 | 1,819.5 | 1,740.2 | 1,664.4 |
| Revenue Growth, % | 0 | 23.3 | -28.21 | -14.7 | 2.18 | -4.36 | -4.36 | -4.36 | -4.36 | -4.36 |
| EBITDA | 781.2 | 1,019.2 | -1,686.7 | 365.7 | -228.3 | -16.1 | -15.4 | -14.7 | -14.1 | -13.5 |
| EBITDA, % | 28.98 | 30.66 | -70.69 | 17.97 | -10.98 | -0.81038 | -0.81038 | -0.81038 | -0.81038 | -0.81038 |
| Depreciation | 249.7 | 279.5 | 404.6 | 247.5 | 197.7 | 223.9 | 214.2 | 204.9 | 195.9 | 187.4 |
| Depreciation, % | 9.26 | 8.41 | 16.95 | 12.16 | 9.51 | 11.26 | 11.26 | 11.26 | 11.26 | 11.26 |
| EBIT | 531.5 | 739.7 | -2,091.2 | 118.2 | -426.0 | -240.1 | -229.6 | -219.6 | -210.0 | -200.9 |
| EBIT, % | 19.71 | 22.26 | -87.64 | 5.81 | -20.48 | -12.07 | -12.07 | -12.07 | -12.07 | -12.07 |
| Total Cash | 5,400.6 | 6,336.0 | 5,242.2 | 4,901.5 | 3,974.4 | 1,989.1 | 1,902.4 | 1,819.5 | 1,740.2 | 1,664.4 |
| Total Cash, percent | .0 | .0 | .0 | .0 | .0 | .0 | .0 | .0 | .0 | .0 |
| Account Receivables | 426.5 | 852.3 | 571.3 | 435.2 | 649.7 | 469.5 | 449.1 | 429.5 | 410.8 | 392.9 |
| Account Receivables, % | 15.82 | 25.64 | 23.94 | 21.38 | 31.24 | 23.61 | 23.61 | 23.61 | 23.61 | 23.61 |
| Inventories | 542.5 | 782.5 | 663.7 | 609.7 | 456.2 | 490.8 | 469.4 | 448.9 | 429.4 | 410.7 |
| Inventories, % | 20.12 | 23.54 | 27.82 | 29.95 | 21.93 | 24.67 | 24.67 | 24.67 | 24.67 | 24.67 |
| Accounts Payable | 116.2 | 130.1 | 225.1 | 241.3 | 264.7 | 168.0 | 160.7 | 153.7 | 147.0 | 140.6 |
| Accounts Payable, % | 4.31 | 3.91 | 9.43 | 11.86 | 12.73 | 8.45 | 8.45 | 8.45 | 8.45 | 8.45 |
| Capital Expenditure | -554.2 | -657.5 | -440.3 | -323.2 | -203.9 | -336.1 | -321.4 | -307.4 | -294.0 | -281.2 |
| Capital Expenditure, % | -20.56 | -19.78 | -18.45 | -15.88 | -9.8 | -16.89 | -16.89 | -16.89 | -16.89 | -16.89 |
| Tax Rate, % | 49.41 | 49.41 | 49.41 | 49.41 | 49.41 | 49.41 | 49.41 | 49.41 | 49.41 | 49.41 |
| EBITAT | 328.5 | 621.2 | -1,886.5 | 39.6 | -215.5 | -153.7 | -147.0 | -140.6 | -134.4 | -128.6 |
| Depreciation | ||||||||||
| Changes in Account Receivables | ||||||||||
| Changes in Inventories | ||||||||||
| Changes in Accounts Payable | ||||||||||
| Capital Expenditure | ||||||||||
| UFCF | -828.8 | -408.8 | -1,427.4 | 170.3 | -259.4 | -216.8 | -219.7 | -210.1 | -200.9 | -192.2 |
| WACC, % | 7.3 | 7.76 | 7.89 | 6.72 | 7.07 | 7.35 | 7.35 | 7.35 | 7.35 | 7.35 |
| PV UFCF | ||||||||||
| SUM PV UFCF | -848.6 | |||||||||
| Long Term Growth Rate, % | 2.00 | |||||||||
| Free cash flow (T + 1) | -196 | |||||||||
| Terminal Value | -3,667 | |||||||||
| Present Terminal Value | -2,572 | |||||||||
| Enterprise Value | -3,421 | |||||||||
| Net Debt | -2,822 | |||||||||
| Equity Value | -599 | |||||||||
| Diluted Shares Outstanding, MM | 9,266 | |||||||||
| Equity Value Per Share | -0.06 |
What You Will Receive
- Adjustable Forecast Parameters: Effortlessly modify key assumptions (growth %, margins, WACC) to generate various scenarios.
- Current Market Data: Sihuan Pharmaceutical Holdings Group Ltd.'s (0460HK) financial data pre-loaded to streamline your analysis.
- Instant DCF Calculations: The template automatically computes Net Present Value (NPV) and intrinsic value for your convenience.
- Customizable and Professional Design: A sleek Excel model that caters to your specific valuation requirements.
- Tailored for Analysts and Investors: Perfect for evaluating projections, confirming strategies, and enhancing efficiency.
Key Features
- Customizable Forecast Variables: Adjust essential metrics including revenue growth, EBITDA margin, and capital expenditure projections.
- Instant DCF Valuation: Provides real-time calculations of intrinsic value, net present value (NPV), and additional financial metrics.
- High-Precision Accuracy: Leverages Sihuan Pharmaceutical's actual financial data for dependable valuation results.
- Simplified Scenario Analysis: Easily evaluate various assumptions and juxtapose results for informed decision-making.
- Efficiency Boost: Streamline the valuation process by eliminating the need to create intricate financial models from the ground up.
How It Operates
- 1. Access the Template: Download and open the Excel file containing Sihuan Pharmaceutical Holdings Group Ltd.'s preloaded data.
- 2. Modify Assumptions: Adjust critical inputs such as growth projections, WACC, and capital expenditures.
- 3. Instant Results: The DCF model automatically calculates the intrinsic value and NPV in real time.
- 4. Explore Scenarios: Analyze various forecasts to evaluate different valuation results.
- 5. Present with Confidence: Showcase professional valuation insights to bolster your strategic decisions.
Why Choose This Calculator for Sihuan Pharmaceutical Holdings Group Ltd. (0460HK)?
- User-Friendly Interface: Ideal for both novice and experienced users.
- Adjustable Parameters: Tailor inputs to suit your specific analysis needs.
- Real-Time Feedback: Observe immediate changes in Sihuan's valuation with every input adjustment.
- Pre-Configured: Includes Sihuan’s actual financial data for swift evaluations.
- Preferred by Experts: Utilized by investors and analysts for well-informed decision-making.
Who Can Benefit from This Product?
- Pharmaceutical Students: Explore valuation methodologies and apply them with real-world data.
- Researchers: Integrate professional valuation models into your studies or academic projects.
- Investors: Validate your own hypotheses and evaluate valuation scenarios for Sihuan Pharmaceutical (0460HK).
- Market Analysts: Enhance your efficiency with a customizable DCF model tailored for pharmaceutical companies.
- Entrepreneurs: Understand the analytical approaches used for assessing large pharmaceutical firms like Sihuan Pharmaceutical (0460HK).
Contents of the Template
- Historical Data: Contains Sihuan Pharmaceutical's past financials and baseline projections.
- DCF and Levered DCF Models: Comprehensive templates for evaluating Sihuan Pharmaceutical’s intrinsic value.
- WACC Sheet: Pre-configured calculations for the Weighted Average Cost of Capital.
- Editable Inputs: Adjust crucial parameters such as growth rates, EBITDA %, and CAPEX forecasts.
- Quarterly and Annual Statements: An extensive breakdown of Sihuan Pharmaceutical’s financial performance.
- Interactive Dashboard: Dynamically visualize valuation outcomes and future projections.
Disclaimer
All information, articles, and product details provided on this website are for general informational and educational purposes only. We do not claim any ownership over, nor do we intend to infringe upon, any trademarks, copyrights, logos, brand names, or other intellectual property mentioned or depicted on this site. Such intellectual property remains the property of its respective owners, and any references here are made solely for identification or informational purposes, without implying any affiliation, endorsement, or partnership.
We make no representations or warranties, express or implied, regarding the accuracy, completeness, or suitability of any content or products presented. Nothing on this website should be construed as legal, tax, investment, financial, medical, or other professional advice. In addition, no part of this site—including articles or product references—constitutes a solicitation, recommendation, endorsement, advertisement, or offer to buy or sell any securities, franchises, or other financial instruments, particularly in jurisdictions where such activity would be unlawful.
All content is of a general nature and may not address the specific circumstances of any individual or entity. It is not a substitute for professional advice or services. Any actions you take based on the information provided here are strictly at your own risk. You accept full responsibility for any decisions or outcomes arising from your use of this website and agree to release us from any liability in connection with your use of, or reliance upon, the content or products found herein.