
|
تقييم Fosun International Limited (0656.HK) DCF |
Fully Editable: Tailor To Your Needs In Excel Or Sheets
Professional Design: Trusted, Industry-Standard Templates
Investor-Approved Valuation Models
MAC/PC Compatible, Fully Unlocked
No Expertise Is Needed; Easy To Follow
Fosun International Limited (0656.HK) Bundle
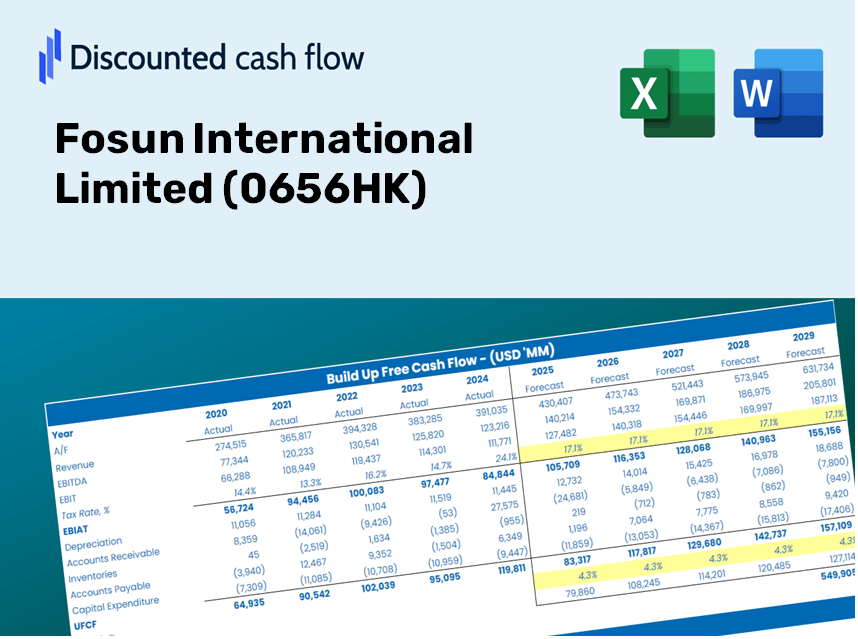
Gain mastery over your Fosun International Limited (0656HK) valuation analysis using our state-of-the-art DCF Calculator! Preloaded with actual (0656HK) data, this Excel template enables you to adjust forecasts and assumptions, allowing for precise calculation of Fosun International Limited's intrinsic value.
Discounted Cash Flow (DCF) - (USD MM)
| Year | AY1 2020 |
AY2 2021 |
AY3 2022 |
AY4 2023 |
AY5 2024 |
FY1 2025 |
FY2 2026 |
FY3 2027 |
FY4 2028 |
FY5 2029 |
|---|---|---|---|---|---|---|---|---|---|---|
| Revenue | 149,575.1 | 176,428.8 | 199,546.9 | 216,801.9 | 210,175.0 | 229,430.8 | 250,450.7 | 273,396.5 | 298,444.4 | 325,787.2 |
| Revenue Growth, % | 0 | 17.95 | 13.1 | 8.65 | -3.06 | 9.16 | 9.16 | 9.16 | 9.16 | 9.16 |
| EBITDA | 5,487.9 | 4,433.2 | 1,120.6 | 33,365.8 | 359.9 | 10,234.7 | 11,172.4 | 12,195.9 | 13,313.3 | 14,533.1 |
| EBITDA, % | 3.67 | 2.51 | 0.56158 | 15.39 | 0.17124 | 4.46 | 4.46 | 4.46 | 4.46 | 4.46 |
| Depreciation | 5,988.7 | 6,349.6 | 7,274.1 | 11,547.9 | 8,109.9 | 9,376.0 | 10,235.0 | 11,172.7 | 12,196.3 | 13,313.7 |
| Depreciation, % | 4 | 3.6 | 3.65 | 5.33 | 3.86 | 4.09 | 4.09 | 4.09 | 4.09 | 4.09 |
| EBIT | -500.8 | -1,916.4 | -6,153.5 | 21,817.9 | -7,750.0 | 858.7 | 937.4 | 1,023.2 | 1,117.0 | 1,219.3 |
| EBIT, % | -0.33485 | -1.09 | -3.08 | 10.06 | -3.69 | 0.37427 | 0.37427 | 0.37427 | 0.37427 | 0.37427 |
| Total Cash | 182,616.0 | 182,597.9 | 164,494.1 | 145,775.2 | 145,578.8 | 192,234.6 | 209,846.7 | 229,072.4 | 250,059.5 | 272,969.4 |
| Total Cash, percent | .0 | .0 | .0 | .0 | .0 | .0 | .0 | .0 | .0 | .0 |
| Account Receivables | 35,683.9 | 48,986.8 | 86,354.8 | 47,790.2 | 59,854.4 | 66,727.5 | 72,840.9 | 79,514.4 | 86,799.4 | 94,751.7 |
| Account Receivables, % | 23.86 | 27.77 | 43.28 | 22.04 | 28.48 | 29.08 | 29.08 | 29.08 | 29.08 | 29.08 |
| Inventories | 72,619.8 | 82,095.9 | 114,085.5 | 98,018.2 | 76,765.8 | 107,369.3 | 117,206.3 | 127,944.5 | 139,666.4 | 152,462.4 |
| Inventories, % | 48.55 | 46.53 | 57.17 | 45.21 | 36.52 | 46.8 | 46.8 | 46.8 | 46.8 | 46.8 |
| Accounts Payable | 20,018.5 | 23,649.4 | 26,683.0 | 29,005.1 | 25,176.0 | 30,063.3 | 32,817.6 | 35,824.3 | 39,106.4 | 42,689.3 |
| Accounts Payable, % | 13.38 | 13.4 | 13.37 | 13.38 | 11.98 | 13.1 | 13.1 | 13.1 | 13.1 | 13.1 |
| Capital Expenditure | -6,737.6 | -6,908.0 | -7,892.6 | -14,408.8 | -12,333.3 | -11,420.8 | -12,467.1 | -13,609.3 | -14,856.2 | -16,217.3 |
| Capital Expenditure, % | -4.5 | -3.92 | -3.96 | -6.65 | -5.87 | -4.98 | -4.98 | -4.98 | -4.98 | -4.98 |
| Tax Rate, % | 1371.41 | 1371.41 | 1371.41 | 1371.41 | 1371.41 | 1371.41 | 1371.41 | 1371.41 | 1371.41 | 1371.41 |
| EBITAT | -236.3 | -784.2 | 478.7 | 3,822.4 | 98,534.0 | 181.4 | 198.0 | 216.1 | 235.9 | 257.6 |
| Depreciation | ||||||||||
| Changes in Account Receivables | ||||||||||
| Changes in Inventories | ||||||||||
| Changes in Accounts Payable | ||||||||||
| Capital Expenditure | ||||||||||
| UFCF | -89,270.3 | -20,490.8 | -66,463.8 | 57,915.6 | 99,669.6 | -34,452.7 | -15,230.2 | -16,625.5 | -18,148.7 | -19,811.5 |
| WACC, % | 3.17 | 2.88 | 1.02 | 1.82 | 1.02 | 1.98 | 1.98 | 1.98 | 1.98 | 1.98 |
| PV UFCF | ||||||||||
| SUM PV UFCF | -98,844.2 | |||||||||
| Long Term Growth Rate, % | 2.00 | |||||||||
| Free cash flow (T + 1) | -20,208 | |||||||||
| Terminal Value | 103,334,368 | |||||||||
| Present Terminal Value | 93,682,891 | |||||||||
| Enterprise Value | 93,584,047 | |||||||||
| Net Debt | 166,397 | |||||||||
| Equity Value | 93,417,650 | |||||||||
| Diluted Shares Outstanding, MM | 8,135 | |||||||||
| Equity Value Per Share | 11,482.76 |
What You Will Receive
- Editable Forecast Inputs: Easily modify assumptions (growth %, margins, WACC) to explore various scenarios.
- Real-World Data: Fosun International Limited’s (0656HK) financial data pre-loaded to enhance your analysis.
- Automatic DCF Outputs: The template computes Net Present Value (NPV) and intrinsic value automatically for your convenience.
- Customizable and Professional: A refined Excel model designed to meet your valuation requirements.
- Built for Analysts and Investors: Perfect for testing projections, validating strategies, and optimizing your time.
Core Features
- Customizable Financial Inputs: Adjust essential metrics such as revenue growth, EBITDA margin, and capital expenditures.
- Instant DCF Valuation: Quickly generates intrinsic value, NPV, and other financial metrics.
- High-Precision Accuracy: Leverages Fosun International Limited's (0656HK) actual financial data for reliable valuation results.
- Simplified Scenario Analysis: Evaluate various assumptions and analyze outcomes effortlessly.
- Efficiency Booster: Streamlines the valuation process by removing the need to create intricate models from the ground up.
How It Functions
- 1. Access the Template: Download and open the Excel file featuring Fosun International Limited’s preloaded data.
- 2. Adjust Key Assumptions: Modify essential inputs such as growth rates, WACC, and capital expenditures.
- 3. Instant Results: The DCF model automatically calculates the intrinsic value and NPV in real-time.
- 4. Experiment with Scenarios: Analyze various forecasts to evaluate different valuation outcomes.
- 5. Present with Assurance: Share professional valuation insights to back your decision-making.
Why Select This Calculator for Fosun International Limited (0656HK)?
- User-Friendly Interface: Ideal for both novices and seasoned professionals.
- Customizable Inputs: Adjust parameters easily to suit your financial analysis.
- Real-Time Updates: Observe immediate changes in Fosun’s valuation as you modify inputs.
- Pre-Configured Data: Comes loaded with Fosun’s actual financial statistics for rapid assessments.
- Relied Upon by Experts: Utilized by investors and analysts to enhance decision-making.
Who Should Utilize This Product?
- Investors: Evaluate Fosun International Limited’s (0656HK) valuation prior to making stock transactions.
- CFOs and Financial Analysts: Optimize valuation procedures and validate financial forecasts.
- Startup Founders: Gain insights into the valuation methods applied to established companies like Fosun International Limited.
- Consultants: Produce comprehensive valuation reports tailored for clients.
- Students and Educators: Utilize real-time data to practice and impart valuation skills.
Overview of the Template's Components
- Historical Data: Contains Fosun International Limited's (0656HK) past financial performance and foundational forecasts.
- DCF and Levered DCF Models: Comprehensive templates for determining the intrinsic value of Fosun International Limited (0656HK).
- WACC Sheet: Pre-configured calculations for the Weighted Average Cost of Capital.
- Editable Inputs: Customize key metrics such as growth rates, EBITDA percentages, and CAPEX assumptions.
- Quarterly and Annual Statements: A thorough analysis of Fosun International Limited's (0656HK) financials.
- Interactive Dashboard: Engage with dynamic visualizations of valuation outcomes and forecasts.
Disclaimer
All information, articles, and product details provided on this website are for general informational and educational purposes only. We do not claim any ownership over, nor do we intend to infringe upon, any trademarks, copyrights, logos, brand names, or other intellectual property mentioned or depicted on this site. Such intellectual property remains the property of its respective owners, and any references here are made solely for identification or informational purposes, without implying any affiliation, endorsement, or partnership.
We make no representations or warranties, express or implied, regarding the accuracy, completeness, or suitability of any content or products presented. Nothing on this website should be construed as legal, tax, investment, financial, medical, or other professional advice. In addition, no part of this site—including articles or product references—constitutes a solicitation, recommendation, endorsement, advertisement, or offer to buy or sell any securities, franchises, or other financial instruments, particularly in jurisdictions where such activity would be unlawful.
All content is of a general nature and may not address the specific circumstances of any individual or entity. It is not a substitute for professional advice or services. Any actions you take based on the information provided here are strictly at your own risk. You accept full responsibility for any decisions or outcomes arising from your use of this website and agree to release us from any liability in connection with your use of, or reliance upon, the content or products found herein.