
|
Skyworth Group Limited (0751.HK) تقييم DCF |
Fully Editable: Tailor To Your Needs In Excel Or Sheets
Professional Design: Trusted, Industry-Standard Templates
Investor-Approved Valuation Models
MAC/PC Compatible, Fully Unlocked
No Expertise Is Needed; Easy To Follow
Skyworth Group Limited (0751.HK) Bundle
Engineered for accuracy, our Skyworth Group Limited (0751HK) DCF Calculator empowers you to evaluate the company's valuation using real-world financial data while offering complete flexibility to adjust all essential parameters for improved projections.
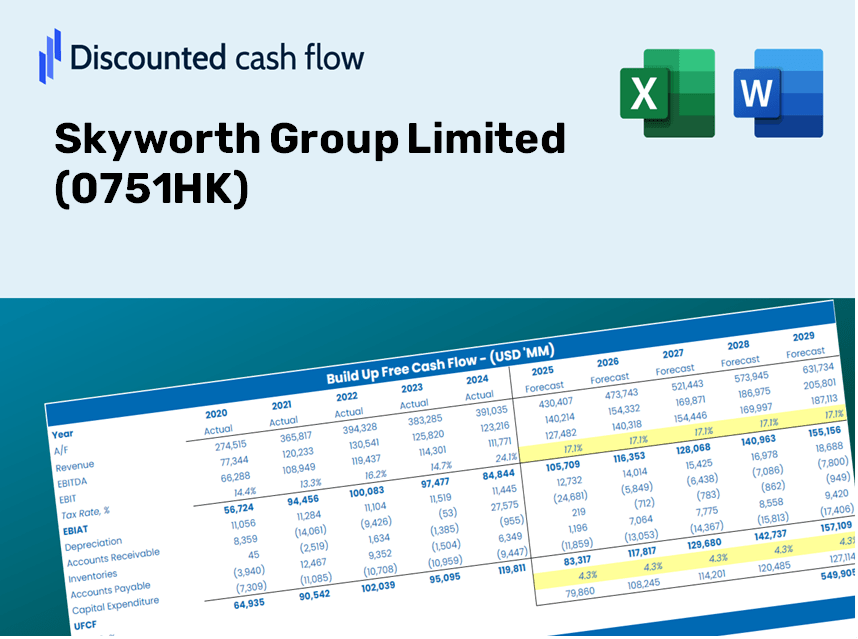
Discounted Cash Flow (DCF) - (USD MM)
| Year | AY1 2020 |
AY2 2021 |
AY3 2022 |
AY4 2023 |
AY5 2024 |
FY1 2025 |
FY2 2026 |
FY3 2027 |
FY4 2028 |
FY5 2029 |
|---|---|---|---|---|---|---|---|---|---|---|
| Revenue | 49,248.2 | 67,095.5 | 67,996.8 | 75,460.2 | 71,068.0 | 78,661.3 | 87,066.0 | 96,368.6 | 106,665.2 | 118,062.0 |
| Revenue Growth, % | 0 | 36.24 | 1.34 | 10.98 | -5.82 | 10.68 | 10.68 | 10.68 | 10.68 | 10.68 |
| EBITDA | 3,568.0 | 3,972.5 | 3,286.0 | 3,769.1 | 1,775.3 | 4,010.3 | 4,438.8 | 4,913.0 | 5,438.0 | 6,019.0 |
| EBITDA, % | 7.24 | 5.92 | 4.83 | 4.99 | 2.5 | 5.1 | 5.1 | 5.1 | 5.1 | 5.1 |
| Depreciation | 704.0 | 678.8 | 825.3 | 659.2 | 623.1 | 850.4 | 941.2 | 1,041.8 | 1,153.1 | 1,276.3 |
| Depreciation, % | 1.43 | 1.01 | 1.21 | 0.87352 | 0.87675 | 1.08 | 1.08 | 1.08 | 1.08 | 1.08 |
| EBIT | 2,864.0 | 3,293.6 | 2,460.6 | 3,110.0 | 1,152.2 | 3,159.9 | 3,497.6 | 3,871.3 | 4,284.9 | 4,742.7 |
| EBIT, % | 5.82 | 4.91 | 3.62 | 4.12 | 1.62 | 4.02 | 4.02 | 4.02 | 4.02 | 4.02 |
| Total Cash | 13,541.3 | 13,280.5 | 11,036.3 | 10,741.1 | 10,342.2 | 14,521.9 | 16,073.5 | 17,790.9 | 19,691.8 | 21,795.8 |
| Total Cash, percent | .0 | .0 | .0 | .0 | .0 | .0 | .0 | .0 | .0 | .0 |
| Account Receivables | 22,096.6 | 21,006.0 | 17,597.1 | 18,599.7 | 20,216.4 | 24,408.6 | 27,016.5 | 29,903.1 | 33,098.2 | 36,634.6 |
| Account Receivables, % | 44.87 | 31.31 | 25.88 | 24.65 | 28.45 | 31.03 | 31.03 | 31.03 | 31.03 | 31.03 |
| Inventories | 14,320.2 | 14,651.3 | 17,813.7 | 17,410.4 | 18,067.3 | 19,760.8 | 21,872.2 | 24,209.1 | 26,795.8 | 29,658.8 |
| Inventories, % | 29.08 | 21.84 | 26.2 | 23.07 | 25.42 | 25.12 | 25.12 | 25.12 | 25.12 | 25.12 |
| Accounts Payable | 13,007.2 | 12,974.4 | 27,637.7 | 29,040.2 | 29,773.7 | 26,237.2 | 29,040.6 | 32,143.4 | 35,577.8 | 39,379.2 |
| Accounts Payable, % | 26.41 | 19.34 | 40.65 | 38.48 | 41.89 | 33.35 | 33.35 | 33.35 | 33.35 | 33.35 |
| Capital Expenditure | -2,041.5 | -2,762.7 | -3,129.7 | -1,985.1 | -1,344.6 | -2,735.6 | -3,027.8 | -3,351.4 | -3,709.4 | -4,105.8 |
| Capital Expenditure, % | -4.15 | -4.12 | -4.6 | -2.63 | -1.89 | -3.48 | -3.48 | -3.48 | -3.48 | -3.48 |
| Tax Rate, % | 67.32 | 67.32 | 67.32 | 67.32 | 67.32 | 67.32 | 67.32 | 67.32 | 67.32 | 67.32 |
| EBITAT | 1,891.8 | 2,108.8 | 1,118.7 | 1,431.1 | 376.5 | 1,606.8 | 1,778.5 | 1,968.5 | 2,178.8 | 2,411.6 |
| Depreciation | ||||||||||
| Changes in Account Receivables | ||||||||||
| Changes in Inventories | ||||||||||
| Changes in Accounts Payable | ||||||||||
| Capital Expenditure | ||||||||||
| UFCF | -22,855.3 | 751.7 | 13,724.1 | 908.5 | -1,885.2 | -9,700.5 | -2,224.1 | -2,461.8 | -2,724.8 | -3,015.9 |
| WACC, % | 4.41 | 4.37 | 3.94 | 3.96 | 3.65 | 4.07 | 4.07 | 4.07 | 4.07 | 4.07 |
| PV UFCF | ||||||||||
| SUM PV UFCF | -18,353.2 | |||||||||
| Long Term Growth Rate, % | 2.00 | |||||||||
| Free cash flow (T + 1) | -3,076 | |||||||||
| Terminal Value | -148,800 | |||||||||
| Present Terminal Value | -121,907 | |||||||||
| Enterprise Value | -140,260 | |||||||||
| Net Debt | 8,806 | |||||||||
| Equity Value | -149,067 | |||||||||
| Diluted Shares Outstanding, MM | 2,310 | |||||||||
| Equity Value Per Share | -64.54 |
Benefits You Will Receive
- Pre-Loaded Financial Model: Skyworth Group Limited’s (0751HK) actual figures provide an accurate DCF valuation.
- Comprehensive Forecast Control: Modify revenue growth, profit margins, WACC, and other essential factors.
- Real-Time Calculations: Automatic updates allow you to view results instantly as you implement changes.
- Professional-Grade Template: A polished Excel file crafted for serious valuation purposes.
- Adaptable and Reusable: Designed with flexibility in mind, enabling ongoing use for thorough forecasts.
Key Features of Skyworth Group Limited (0751HK)
- Customizable Forecast Inputs: Adjust essential factors such as revenue growth, EBITDA percentages, and capital expenditures to suit your analysis.
- Instant DCF Valuation: Quickly computes intrinsic value, NPV, and additional metrics with just a click.
- Accurate Valuation Insights: Leverages Skyworth's real-world financial data for reliable valuation results.
- Simplified Scenario Analysis: Easily evaluate various assumptions and analyze their outcomes side by side.
- Efficiency-Boosting Tool: Remove the hassle of creating complex valuation models from the ground up.
How It Operates
- Download: Obtain the pre-prepared Excel file containing Skyworth Group Limited’s financial data.
- Customize: Modify projections, such as revenue growth, EBITDA %, and WACC.
- Update Automatically: The intrinsic value and NPV calculations refresh in real-time.
- Test Scenarios: Generate various forecasts and instantly compare results.
- Make Decisions: Utilize the valuation findings to inform your investment strategy.
Why Choose This Calculator for Skyworth Group Limited (0751HK)?
- Designed for Professionals: An advanced tool utilized by analysts, CFOs, and consultants in the industry.
- Accurate Data: Skyworth's historical and projected financial information is preloaded for precision.
- Forecast Simulation: Effortlessly test various scenarios and assumptions.
- Comprehensive Outputs: Automatically computes intrinsic value, NPV, and essential metrics.
- User-Friendly: Step-by-step guidance ensures a smooth experience throughout the process.
Who Can Benefit From This Product?
- Investors: Evaluate the valuation of Skyworth Group Limited (0751HK) before making stock transactions.
- CFOs and Financial Analysts: Optimize the valuation workflow and assess financial forecasts.
- Startup Founders: Understand how established companies like Skyworth Group Limited (0751HK) are assessed in terms of value.
- Consultants: Provide comprehensive valuation reports to their clients regarding Skyworth Group Limited (0751HK).
- Students and Educators: Utilize real-life data to practice and teach valuation methodologies involving Skyworth Group Limited (0751HK).
What the Template Includes
- Comprehensive DCF Model: Editable template featuring intricate valuation calculations.
- Real-World Data: Skyworth Group Limited’s historical and projected financials preloaded for in-depth analysis.
- Customizable Parameters: Tailor WACC, growth rates, and tax assumptions to explore various scenarios.
- Financial Statements: Complete annual and quarterly breakdowns for enhanced insights.
- Key Ratios: Integrated analysis tools for assessing profitability, efficiency, and leverage.
- Dashboard with Visual Outputs: Charts and tables providing clear, actionable results.
Disclaimer
All information, articles, and product details provided on this website are for general informational and educational purposes only. We do not claim any ownership over, nor do we intend to infringe upon, any trademarks, copyrights, logos, brand names, or other intellectual property mentioned or depicted on this site. Such intellectual property remains the property of its respective owners, and any references here are made solely for identification or informational purposes, without implying any affiliation, endorsement, or partnership.
We make no representations or warranties, express or implied, regarding the accuracy, completeness, or suitability of any content or products presented. Nothing on this website should be construed as legal, tax, investment, financial, medical, or other professional advice. In addition, no part of this site—including articles or product references—constitutes a solicitation, recommendation, endorsement, advertisement, or offer to buy or sell any securities, franchises, or other financial instruments, particularly in jurisdictions where such activity would be unlawful.
All content is of a general nature and may not address the specific circumstances of any individual or entity. It is not a substitute for professional advice or services. Any actions you take based on the information provided here are strictly at your own risk. You accept full responsibility for any decisions or outcomes arising from your use of this website and agree to release us from any liability in connection with your use of, or reliance upon, the content or products found herein.