
|
شركة Guangzhou Baiyunshan Pharmaceutical Holdings Company Limited (0874.HK) تقييم DCF |
Fully Editable: Tailor To Your Needs In Excel Or Sheets
Professional Design: Trusted, Industry-Standard Templates
Investor-Approved Valuation Models
MAC/PC Compatible, Fully Unlocked
No Expertise Is Needed; Easy To Follow
Guangzhou Baiyunshan Pharmaceutical Holdings Company Limited (0874.HK) Bundle
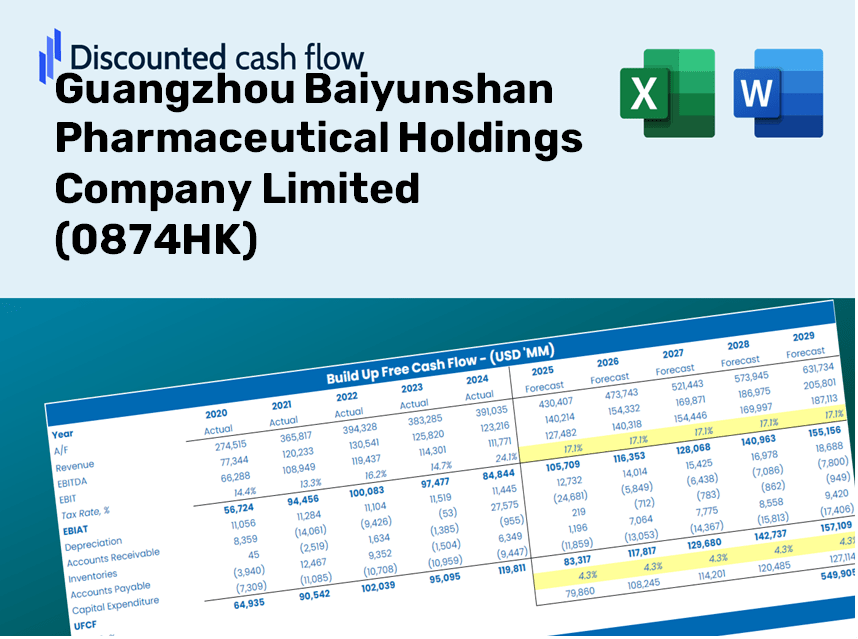
Evaluate the financial prospects of Guangzhou Baiyunshan Pharmaceutical Holdings Company Limited like an expert! This (0874HK) DCF Calculator provides pre-filled financial data and offers complete flexibility to modify revenue growth, WACC, margins, and other essential assumptions to align with your forecasts.
Discounted Cash Flow (DCF) - (USD MM)
| Year | AY1 2020 |
AY2 2021 |
AY3 2022 |
AY4 2023 |
AY5 2024 |
FY1 2025 |
FY2 2026 |
FY3 2027 |
FY4 2028 |
FY5 2029 |
|---|---|---|---|---|---|---|---|---|---|---|
| Revenue | 67,322.0 | 75,334.6 | 77,271.2 | 82,431.4 | 81,861.0 | 86,047.8 | 90,448.9 | 95,075.0 | 99,937.8 | 105,049.2 |
| Revenue Growth, % | 0 | 11.9 | 2.57 | 6.68 | -0.69202 | 5.11 | 5.11 | 5.11 | 5.11 | 5.11 |
| EBITDA | 5,108.5 | 6,350.7 | 5,459.6 | 7,080.2 | 5,349.8 | 6,575.4 | 6,911.8 | 7,265.3 | 7,636.9 | 8,027.5 |
| EBITDA, % | 7.59 | 8.43 | 7.07 | 8.59 | 6.54 | 7.64 | 7.64 | 7.64 | 7.64 | 7.64 |
| Depreciation | 703.2 | 739.0 | 812.0 | 1,014.6 | 955.4 | 942.1 | 990.3 | 1,040.9 | 1,094.1 | 1,150.1 |
| Depreciation, % | 1.04 | 0.98095 | 1.05 | 1.23 | 1.17 | 1.09 | 1.09 | 1.09 | 1.09 | 1.09 |
| EBIT | 4,405.3 | 5,611.7 | 4,647.7 | 6,065.6 | 4,394.4 | 5,633.4 | 5,921.5 | 6,224.4 | 6,542.7 | 6,877.4 |
| EBIT, % | 6.54 | 7.45 | 6.01 | 7.36 | 5.37 | 6.55 | 6.55 | 6.55 | 6.55 | 6.55 |
| Total Cash | 21,257.8 | 24,426.3 | 24,622.2 | 23,264.8 | 24,800.1 | 26,568.7 | 27,927.6 | 29,356.0 | 30,857.4 | 32,435.7 |
| Total Cash, percent | .0 | .0 | .0 | .0 | .0 | .0 | .0 | .0 | .0 | .0 |
| Account Receivables | 17,962.2 | 20,073.4 | 21,924.4 | 21,392.5 | 22,322.2 | 23,219.2 | 24,406.8 | 25,655.1 | 26,967.3 | 28,346.6 |
| Account Receivables, % | 26.68 | 26.65 | 28.37 | 25.95 | 27.27 | 26.98 | 26.98 | 26.98 | 26.98 | 26.98 |
| Inventories | 10,658.8 | 11,393.7 | 11,648.9 | 12,561.0 | 13,985.3 | 13,484.4 | 14,174.1 | 14,899.1 | 15,661.1 | 16,462.1 |
| Inventories, % | 15.83 | 15.12 | 15.08 | 15.24 | 17.08 | 15.67 | 15.67 | 15.67 | 15.67 | 15.67 |
| Accounts Payable | 15,456.1 | 16,082.3 | 16,331.0 | 17,122.4 | 17,814.1 | 18,581.9 | 19,532.3 | 20,531.3 | 21,581.4 | 22,685.2 |
| Accounts Payable, % | 22.96 | 21.35 | 21.13 | 20.77 | 21.76 | 21.59 | 21.59 | 21.59 | 21.59 | 21.59 |
| Capital Expenditure | -956.8 | -1,369.8 | -1,510.6 | -1,777.6 | -1,231.5 | -1,524.0 | -1,601.9 | -1,683.8 | -1,770.0 | -1,860.5 |
| Capital Expenditure, % | -1.42 | -1.82 | -1.95 | -2.16 | -1.5 | -1.77 | -1.77 | -1.77 | -1.77 | -1.77 |
| Tax Rate, % | 21.4 | 21.4 | 21.4 | 21.4 | 21.4 | 21.4 | 21.4 | 21.4 | 21.4 | 21.4 |
| EBITAT | 3,434.7 | 4,419.8 | 3,655.4 | 4,813.6 | 3,453.9 | 4,431.6 | 4,658.3 | 4,896.5 | 5,147.0 | 5,410.2 |
| Depreciation | ||||||||||
| Changes in Account Receivables | ||||||||||
| Changes in Inventories | ||||||||||
| Changes in Accounts Payable | ||||||||||
| Capital Expenditure | ||||||||||
| UFCF | -9,983.8 | 1,569.0 | 1,099.2 | 4,461.9 | 1,515.6 | 4,221.3 | 3,119.8 | 3,279.3 | 3,447.1 | 3,623.4 |
| WACC, % | 4.19 | 4.2 | 4.2 | 4.21 | 4.2 | 4.2 | 4.2 | 4.2 | 4.2 | 4.2 |
| PV UFCF | ||||||||||
| SUM PV UFCF | 15,697.9 | |||||||||
| Long Term Growth Rate, % | 2.00 | |||||||||
| Free cash flow (T + 1) | 3,696 | |||||||||
| Terminal Value | 168,197 | |||||||||
| Present Terminal Value | 136,942 | |||||||||
| Enterprise Value | 152,639 | |||||||||
| Net Debt | -6,439 | |||||||||
| Equity Value | 159,079 | |||||||||
| Diluted Shares Outstanding, MM | 1,626 | |||||||||
| Equity Value Per Share | 97.84 |
Benefits You Will Receive
- Authentic Financial Data: Comprehensive financials – encompassing revenue to EBIT – derived from actual and forecasted figures for Guangzhou Baiyunshan Pharmaceutical Holdings Company Limited (0874HK).
- Complete Personalization: Modify all essential parameters (highlighted cells) such as WACC, growth rate, and tax percentages.
- Instant Valuation Adjustments: Automatic recalibrations to evaluate the effects of changes on the fair value of Guangzhou Baiyunshan Pharmaceutical Holdings Company Limited (0874HK).
- Flexible Excel Template: Designed for easy modifications, scenario analysis, and in-depth projections.
- Efficient and Precise: Eliminate the need to build models from scratch while ensuring accuracy and adaptability.
Key Features
- 🔍 Real-Life 0874HK Financials: Pre-filled historical and projected data for Guangzhou Baiyunshan Pharmaceutical Holdings Company Limited.
- ✏️ Fully Customizable Inputs: Adjust crucial parameters (yellow cells) such as WACC, growth %, and tax rates.
- 📊 Professional DCF Valuation: Integrated formulas calculate the intrinsic value of Guangzhou Baiyunshan using the Discounted Cash Flow method.
- ⚡ Instant Results: Visualize the valuation of Guangzhou Baiyunshan immediately after adjustments.
- Scenario Analysis: Evaluate and compare outcomes for different financial assumptions side-by-side.
How It Functions
- Download: Obtain the pre-formatted Excel file containing Guangzhou Baiyunshan Pharmaceutical Holdings Company Limited’s financial data.
- Customize: Modify forecasts such as revenue growth, EBITDA %, and WACC as needed.
- Auto-Update: Intrinsic value and NPV calculations refresh in real-time for accuracy.
- Scenario Testing: Generate various projections and analyze outcomes immediately.
- Informed Decisions: Leverage valuation results to inform your investment strategies.
Why Choose This Calculator for Guangzhou Baiyunshan Pharmaceutical Holdings Company Limited (0874HK)?
- Time Efficient: Skip the hassle of building a DCF model from the ground up – it’s ready for immediate use.
- Enhanced Accuracy: Dependable financial data and formulas minimize valuation errors.
- Completely Customizable: Adapt the model to align with your specific assumptions and forecasts.
- Simple to Understand: Intuitive charts and outputs facilitate straightforward analysis of results.
- Endorsed by Professionals: Crafted for experts who prioritize both precision and functionality.
Who Can Benefit from This Product?
- Investors: Evaluate Guangzhou Baiyunshan Pharmaceutical Holdings Company Limited's (0874HK) valuation prior to making investment decisions.
- CFOs and Financial Analysts: Enhance valuation methodologies and assess financial forecasts for (0874HK).
- Startup Founders: Gain insights into how leading pharmaceutical firms like Guangzhou Baiyunshan (0874HK) are appraised.
- Consultants: Create in-depth valuation reports for clients with a focus on (0874HK).
- Students and Educators: Utilize real market data to practice and teach valuation strategies using (0874HK).
Contents of the Template
- Pre-Filled Data: Contains Guangzhou Baiyunshan's historical financials and projections.
- Discounted Cash Flow Model: An editable DCF valuation model with automatic computations.
- Weighted Average Cost of Capital (WACC): A dedicated worksheet for calculating WACC based on user-defined inputs.
- Key Financial Ratios: Evaluate Guangzhou Baiyunshan's profitability, operational efficiency, and leverage ratios.
- Customizable Inputs: Easily modify revenue growth, profit margins, and tax rates.
- Clear Dashboard: Graphs and tables summarizing essential valuation outcomes.
Disclaimer
All information, articles, and product details provided on this website are for general informational and educational purposes only. We do not claim any ownership over, nor do we intend to infringe upon, any trademarks, copyrights, logos, brand names, or other intellectual property mentioned or depicted on this site. Such intellectual property remains the property of its respective owners, and any references here are made solely for identification or informational purposes, without implying any affiliation, endorsement, or partnership.
We make no representations or warranties, express or implied, regarding the accuracy, completeness, or suitability of any content or products presented. Nothing on this website should be construed as legal, tax, investment, financial, medical, or other professional advice. In addition, no part of this site—including articles or product references—constitutes a solicitation, recommendation, endorsement, advertisement, or offer to buy or sell any securities, franchises, or other financial instruments, particularly in jurisdictions where such activity would be unlawful.
All content is of a general nature and may not address the specific circumstances of any individual or entity. It is not a substitute for professional advice or services. Any actions you take based on the information provided here are strictly at your own risk. You accept full responsibility for any decisions or outcomes arising from your use of this website and agree to release us from any liability in connection with your use of, or reliance upon, the content or products found herein.