
|
CNOOC Limited (0883.HK) تقييم DCF |
Fully Editable: Tailor To Your Needs In Excel Or Sheets
Professional Design: Trusted, Industry-Standard Templates
Investor-Approved Valuation Models
MAC/PC Compatible, Fully Unlocked
No Expertise Is Needed; Easy To Follow
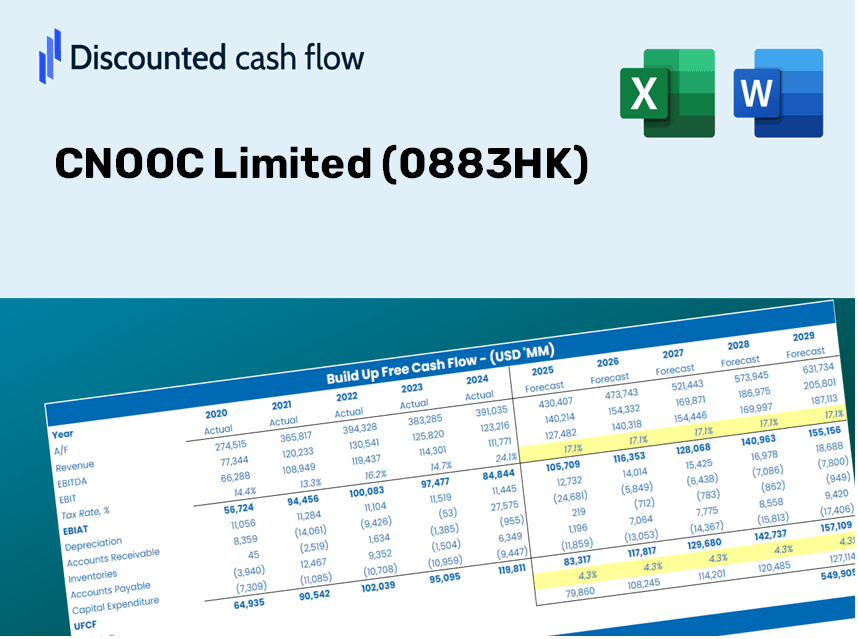
CNOOC Limited (0883.HK) Bundle
Whether you’re an investor or analyst, this CNOOC Limited (0883HK) DCF Calculator is your go-to resource for accurate valuation. Equipped with real data from CNOOC Limited, you can adjust forecasts and instantly observe the effects.
Discounted Cash Flow (DCF) - (USD MM)
| Year | AY1 2020 |
AY2 2021 |
AY3 2022 |
AY4 2023 |
AY5 2024 |
FY1 2025 |
FY2 2026 |
FY3 2027 |
FY4 2028 |
FY5 2029 |
|---|---|---|---|---|---|---|---|---|---|---|
| Revenue | 169,898.3 | 269,120.8 | 472,635.3 | 455,559.3 | 459,820.7 | 610,809.2 | 811,376.9 | 1,077,803.8 | 1,431,715.8 | 1,901,839.6 |
| Revenue Growth, % | 0 | 58.4 | 75.62 | -3.61 | 0.93541 | 32.84 | 32.84 | 32.84 | 32.84 | 32.84 |
| EBITDA | 101,251.0 | 171,189.7 | 285,314.4 | 257,774.7 | 286,167.3 | 369,406.7 | 490,706.6 | 651,836.9 | 865,876.6 | 1,150,199.3 |
| EBITDA, % | 59.6 | 63.61 | 60.37 | 56.58 | 62.23 | 60.48 | 60.48 | 60.48 | 60.48 | 60.48 |
| Depreciation | 64,479.0 | 69,277.2 | 68,966.6 | 77,343.9 | 81,182.1 | 137,943.2 | 183,238.8 | 243,407.8 | 323,334.2 | 429,505.5 |
| Depreciation, % | 37.95 | 25.74 | 14.59 | 16.98 | 17.66 | 22.58 | 22.58 | 22.58 | 22.58 | 22.58 |
| EBIT | 36,772.0 | 101,912.5 | 216,347.7 | 180,430.8 | 204,985.2 | 231,463.5 | 307,467.8 | 408,429.1 | 542,542.5 | 720,693.8 |
| EBIT, % | 21.64 | 37.87 | 45.77 | 39.61 | 44.58 | 37.89 | 37.89 | 37.89 | 37.89 | 37.89 |
| Total Cash | 139,412.8 | 177,331.9 | 229,191.9 | 213,084.7 | 218,662.7 | 355,210.2 | 471,848.4 | 626,786.5 | 832,600.5 | 1,105,996.5 |
| Total Cash, percent | .0 | .0 | .0 | .0 | .0 | .0 | .0 | .0 | .0 | .0 |
| Account Receivables | 20,756.7 | 29,576.8 | 41,544.0 | 40,516.1 | 36,808.1 | 59,731.9 | 79,345.8 | 105,400.1 | 140,009.6 | 185,983.8 |
| Account Receivables, % | 12.22 | 10.99 | 8.79 | 8.89 | 8 | 9.78 | 9.78 | 9.78 | 9.78 | 9.78 |
| Inventories | 6,171.7 | 6,236.2 | 6,822.3 | 7,054.1 | 6,267.9 | 12,588.6 | 16,722.2 | 22,213.2 | 29,507.2 | 39,196.4 |
| Inventories, % | 3.63 | 2.32 | 1.44 | 1.55 | 1.36 | 2.06 | 2.06 | 2.06 | 2.06 | 2.06 |
| Accounts Payable | 19,798.8 | 53,514.5 | 65,378.9 | 67,120.8 | 63,284.9 | 90,238.2 | 119,869.2 | 159,229.9 | 211,515.3 | 280,969.2 |
| Accounts Payable, % | 11.65 | 19.88 | 13.83 | 14.73 | 13.76 | 14.77 | 14.77 | 14.77 | 14.77 | 14.77 |
| Capital Expenditure | -82,469.1 | -90,144.3 | -103,612.9 | -132,262.6 | -134,892.3 | -198,302.1 | -263,417.4 | -349,914.1 | -464,813.3 | -617,441.3 |
| Capital Expenditure, % | -48.54 | -33.5 | -21.92 | -29.03 | -29.34 | -32.47 | -32.47 | -32.47 | -32.47 | -32.47 |
| Tax Rate, % | 27.39 | 27.39 | 27.39 | 27.39 | 27.39 | 27.39 | 27.39 | 27.39 | 27.39 | 27.39 |
| EBITAT | 26,289.3 | 74,790.4 | 157,398.3 | 129,181.8 | 148,833.8 | 167,503.4 | 222,505.5 | 295,568.3 | 392,622.3 | 521,545.3 |
| Depreciation | ||||||||||
| Changes in Account Receivables | ||||||||||
| Changes in Inventories | ||||||||||
| Changes in Accounts Payable | ||||||||||
| Capital Expenditure | ||||||||||
| UFCF | 1,169.6 | 78,754.3 | 122,063.2 | 76,801.1 | 95,781.8 | 104,853.3 | 148,210.5 | 196,877.4 | 261,524.9 | 347,400.2 |
| WACC, % | 5.62 | 5.63 | 5.63 | 5.62 | 5.63 | 5.63 | 5.63 | 5.63 | 5.63 | 5.63 |
| PV UFCF | ||||||||||
| SUM PV UFCF | 873,459.1 | |||||||||
| Long Term Growth Rate, % | 2.00 | |||||||||
| Free cash flow (T + 1) | 354,348 | |||||||||
| Terminal Value | 9,768,280 | |||||||||
| Present Terminal Value | 7,429,033 | |||||||||
| Enterprise Value | 8,302,492 | |||||||||
| Net Debt | -68,134 | |||||||||
| Equity Value | 8,370,626 | |||||||||
| Diluted Shares Outstanding, MM | 47,553 | |||||||||
| Equity Value Per Share | 176.03 |
What You Will Receive
- Customizable Excel Template: A fully adjustable Excel-based DCF Calculator featuring pre-loaded real financial data for CNOOC Limited (0883HK).
- Actual Market Data: Historical figures and forward-looking projections (highlighted in the yellow cells).
- Flexible Forecasting: Adjust key assumptions such as revenue growth, EBITDA margins, and WACC.
- Instant Calculations: Quickly observe how your inputs affect the valuation of CNOOC Limited (0883HK).
- Professional Resource: Designed for investors, CFOs, consultants, and financial analysts.
- User-Friendly Interface: Organized for clarity with easy-to-follow instructions.
Key Features
- Comprehensive DCF Analysis Tool: Features detailed unlevered and levered DCF valuation models tailored for CNOOC Limited (0883HK).
- WACC Estimator: Ready-to-use Weighted Average Cost of Capital sheet with customizable parameters specific to CNOOC Limited (0883HK).
- Adjustable Forecast Parameters: Easily modify growth rates, capital expenditures, and discount rates for accurate projections.
- Integrated Financial Ratios: Evaluate profitability, leverage, and operational efficiency ratios for CNOOC Limited (0883HK).
- Visual Dashboard and Charts: Graphical representations summarize essential valuation metrics for straightforward analysis.
How It Functions
- Download the Template: Gain immediate access to the Excel-based CNOOC Limited (0883HK) DCF Calculator.
- Input Your Assumptions: Modify the yellow-highlighted cells for growth rates, WACC, margins, and additional parameters.
- Instant Calculations: The model automatically recalculates CNOOC Limited’s intrinsic value.
- Test Scenarios: Experiment with various assumptions to assess potential changes in valuation.
- Analyze and Decide: Utilize the findings to inform your investment or financial analysis.
Why Choose This Calculator for CNOOC Limited (0883HK)?
- Designed for Experts: A sophisticated tool utilized by financial analysts, corporate leaders, and industry consultants.
- Accurate Data Integration: CNOOC Limited's historical and projected financial information is preloaded for accuracy.
- Comprehensive Scenario Analysis: Easily simulate various forecasts and assumptions.
- Clear Results: Automatically computes intrinsic value, NPV, and essential performance metrics.
- User-Friendly Interface: Step-by-step guidance makes navigation simple.
Who Should Utilize This Product?
- Individual Investors: Make well-informed decisions regarding the purchase or sale of CNOOC Limited (0883HK) stock.
- Financial Analysts: Enhance valuation methodologies with readily available financial models specific to CNOOC Limited (0883HK).
- Consultants: Provide clients with accurate and timely valuation insights about CNOOC Limited (0883HK).
- Business Owners: Gain insights into how major firms like CNOOC Limited (0883HK) are valued to inform your strategic decisions.
- Finance Students: Master valuation techniques using real data and case studies related to CNOOC Limited (0883HK).
What the Template Includes
- Pre-Filled DCF Model: CNOOC Limited's financial data preloaded for immediate application.
- WACC Calculator: Comprehensive calculations for the Weighted Average Cost of Capital.
- Financial Ratios: Assess CNOOC Limited's profitability, leverage, and operational efficiency.
- Editable Inputs: Modify assumptions such as growth rates, profit margins, and CAPEX to suit your analysis.
- Financial Statements: Access to annual and quarterly reports for thorough examination.
- Interactive Dashboard: Effortlessly visualize essential valuation metrics and results.
Disclaimer
All information, articles, and product details provided on this website are for general informational and educational purposes only. We do not claim any ownership over, nor do we intend to infringe upon, any trademarks, copyrights, logos, brand names, or other intellectual property mentioned or depicted on this site. Such intellectual property remains the property of its respective owners, and any references here are made solely for identification or informational purposes, without implying any affiliation, endorsement, or partnership.
We make no representations or warranties, express or implied, regarding the accuracy, completeness, or suitability of any content or products presented. Nothing on this website should be construed as legal, tax, investment, financial, medical, or other professional advice. In addition, no part of this site—including articles or product references—constitutes a solicitation, recommendation, endorsement, advertisement, or offer to buy or sell any securities, franchises, or other financial instruments, particularly in jurisdictions where such activity would be unlawful.
All content is of a general nature and may not address the specific circumstances of any individual or entity. It is not a substitute for professional advice or services. Any actions you take based on the information provided here are strictly at your own risk. You accept full responsibility for any decisions or outcomes arising from your use of this website and agree to release us from any liability in connection with your use of, or reliance upon, the content or products found herein.