
|
China Suntien Green Energy Corporation Limited (0956.HK) تقييم DCF |
Fully Editable: Tailor To Your Needs In Excel Or Sheets
Professional Design: Trusted, Industry-Standard Templates
Investor-Approved Valuation Models
MAC/PC Compatible, Fully Unlocked
No Expertise Is Needed; Easy To Follow
China Suntien Green Energy Corporation Limited (0956.HK) Bundle
Designed for accuracy, our (0956HK) DCF Calculator enables you to evaluate China Suntien Green Energy Corporation Limited's valuation using actual financial data while offering complete flexibility to modify all essential parameters for improved forecasts.
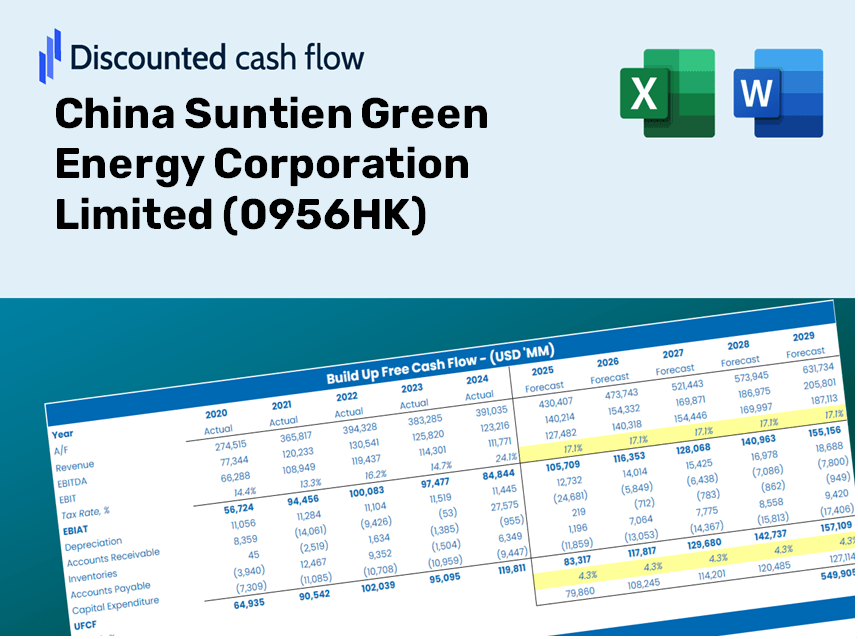
Discounted Cash Flow (DCF) - (USD MM)
| Year | AY1 2020 |
AY2 2021 |
AY3 2022 |
AY4 2023 |
AY5 2024 |
FY1 2025 |
FY2 2026 |
FY3 2027 |
FY4 2028 |
FY5 2029 |
|---|---|---|---|---|---|---|---|---|---|---|
| Revenue | 13,669.8 | 17,632.7 | 20,279.8 | 22,160.6 | 23,351.9 | 26,776.0 | 30,702.2 | 35,204.1 | 40,366.1 | 46,285.1 |
| Revenue Growth, % | 0 | 28.99 | 15.01 | 9.27 | 5.38 | 14.66 | 14.66 | 14.66 | 14.66 | 14.66 |
| EBITDA | 5,210.5 | 7,234.8 | 7,485.0 | 7,459.9 | 7,267.5 | 9,684.4 | 11,104.4 | 12,732.6 | 14,599.6 | 16,740.4 |
| EBITDA, % | 38.12 | 41.03 | 36.91 | 33.66 | 31.12 | 36.17 | 36.17 | 36.17 | 36.17 | 36.17 |
| Depreciation | 1,725.8 | 2,318.0 | 2,535.0 | 2,590.8 | 3,349.4 | 3,443.7 | 3,948.6 | 4,527.6 | 5,191.5 | 5,952.7 |
| Depreciation, % | 12.62 | 13.15 | 12.5 | 11.69 | 14.34 | 12.86 | 12.86 | 12.86 | 12.86 | 12.86 |
| EBIT | 3,484.7 | 4,916.8 | 4,950.0 | 4,869.0 | 3,918.1 | 6,240.7 | 7,155.8 | 8,205.0 | 9,408.2 | 10,787.7 |
| EBIT, % | 25.49 | 27.88 | 24.41 | 21.97 | 16.78 | 23.31 | 23.31 | 23.31 | 23.31 | 23.31 |
| Total Cash | 2,036.1 | 8,230.9 | 8,572.9 | 4,152.1 | 3,339.4 | 7,330.4 | 8,405.3 | 9,637.7 | 11,050.9 | 12,671.4 |
| Total Cash, percent | .0 | .0 | .0 | .0 | .0 | .0 | .0 | .0 | .0 | .0 |
| Account Receivables | 5,776.4 | 7,814.9 | 6,307.3 | 7,050.7 | 8,492.1 | 9,953.2 | 11,412.7 | 13,086.1 | 15,005.0 | 17,205.2 |
| Account Receivables, % | 42.26 | 44.32 | 31.1 | 31.82 | 36.37 | 37.17 | 37.17 | 37.17 | 37.17 | 37.17 |
| Inventories | 63.5 | 234.0 | 114.2 | 1,057.4 | 2,362.9 | 923.5 | 1,058.9 | 1,214.2 | 1,392.2 | 1,596.4 |
| Inventories, % | 0.46448 | 1.33 | 0.56319 | 4.77 | 10.12 | 3.45 | 3.45 | 3.45 | 3.45 | 3.45 |
| Accounts Payable | 198.3 | 516.6 | 455.0 | 532.4 | 590.7 | 618.8 | 709.6 | 813.6 | 932.9 | 1,069.7 |
| Accounts Payable, % | 1.45 | 2.93 | 2.24 | 2.4 | 2.53 | 2.31 | 2.31 | 2.31 | 2.31 | 2.31 |
| Capital Expenditure | -10,773.7 | -8,682.1 | -7,962.7 | -7,187.0 | -8,222.2 | -12,582.5 | -14,427.5 | -16,543.0 | -18,968.7 | -21,750.1 |
| Capital Expenditure, % | -78.81 | -49.24 | -39.26 | -32.43 | -35.21 | -46.99 | -46.99 | -46.99 | -46.99 | -46.99 |
| Tax Rate, % | 28.74 | 28.74 | 28.74 | 28.74 | 28.74 | 28.74 | 28.74 | 28.74 | 28.74 | 28.74 |
| EBITAT | 2,325.0 | 3,449.5 | 3,444.1 | 3,191.0 | 2,792.2 | 4,284.3 | 4,912.5 | 5,632.8 | 6,458.8 | 7,405.9 |
| Depreciation | ||||||||||
| Changes in Account Receivables | ||||||||||
| Changes in Inventories | ||||||||||
| Changes in Accounts Payable | ||||||||||
| Capital Expenditure | ||||||||||
| UFCF | -12,364.5 | -4,805.4 | -417.7 | -3,014.5 | -4,769.2 | -4,848.1 | -7,070.5 | -8,107.2 | -9,296.0 | -10,659.1 |
| WACC, % | 3.74 | 3.83 | 3.81 | 3.7 | 3.86 | 3.79 | 3.79 | 3.79 | 3.79 | 3.79 |
| PV UFCF | ||||||||||
| SUM PV UFCF | -35,350.0 | |||||||||
| Long Term Growth Rate, % | 2.00 | |||||||||
| Free cash flow (T + 1) | -10,872 | |||||||||
| Terminal Value | -608,465 | |||||||||
| Present Terminal Value | -505,271 | |||||||||
| Enterprise Value | -540,621 | |||||||||
| Net Debt | 47,889 | |||||||||
| Equity Value | -588,510 | |||||||||
| Diluted Shares Outstanding, MM | 4,187 | |||||||||
| Equity Value Per Share | -140.55 |
What You Will Receive
- Authentic STGN Financial Data: Provides historical and projected figures for precise valuation.
- Customizable Inputs: Adjust WACC, tax rates, revenue growth, and capital expenditures as needed.
- Real-Time Calculations: Intrinsic value and NPV are computed automatically.
- Scenario Analysis: Explore various scenarios to assess the future performance of China Suntien Green Energy Corporation Limited (0956HK).
- User-Friendly Design: Designed for professionals, yet easy for beginners to navigate.
Key Features
- Customizable Forecast Inputs: Adjust essential parameters such as revenue growth, EBITDA percentage, and capital expenditures.
- Instant DCF Valuation: Computes intrinsic value, NPV, and other critical metrics instantly.
- High-Precision Accuracy: Leverages China Suntien Green Energy Corporation Limited’s (0956HK) actual financial data for authentic valuation results.
- Simplified Scenario Analysis: Easily experiment with various assumptions and assess different outcomes.
- Efficiency Booster: Remove the hassle of creating detailed valuation models from the ground up.
How It Operates
- Download the Template: Gain immediate access to the Excel-based 0956HK DCF Calculator.
- Input Your Assumptions: Modify the yellow-highlighted cells for growth rates, WACC, margins, and other key factors.
- Instant Calculations: The model automatically refreshes to reveal China Suntien Green Energy's intrinsic value.
- Test Scenarios: Experiment with various assumptions to assess potential changes in valuation.
- Analyze and Decide: Utilize the results to inform your investment or financial assessment.
Why Choose This Calculator for China Suntien Green Energy Corporation Limited (0956HK)?
- Designed for Experts: A sophisticated tool utilized by analysts, finance officers, and industry consultants.
- Accurate Data: Historical and projected financial figures for China Suntien preloaded for reliability.
- Forecasting Scenarios: Effortlessly simulate various predictions and underlying assumptions.
- Comprehensive Outputs: Instantly computes intrinsic value, net present value (NPV), and essential metrics.
- User-Friendly: Clear, step-by-step guidance to streamline your calculations.
Who Should Consider This Product?
- Investors: Effectively assess China Suntien Green Energy Corporation Limited’s (0956HK) fair value prior to making investment choices.
- Chief Financial Officers (CFOs): Utilize a high-quality DCF model for comprehensive financial reporting and analysis.
- Consultants: Easily customize the template for client valuation reports related to (0956HK).
- Entrepreneurs: Acquire valuable insights into financial modeling practices adopted by leading companies.
- Educators: Employ this resource as a teaching aid to illustrate valuation techniques.
What the Template Includes
- Pre-Filled DCF Model: China Suntien Green Energy Corporation Limited’s financial data preloaded for immediate analysis.
- WACC Calculator: Comprehensive calculations for Weighted Average Cost of Capital.
- Financial Ratios: Assess China Suntien’s profitability, leverage, and operational efficiency.
- Editable Inputs: Customize assumptions such as growth rates, margins, and CAPEX to suit your specific scenarios.
- Financial Statements: Annual and quarterly reports for in-depth examination.
- Interactive Dashboard: Effortlessly visualize essential valuation metrics and outcomes.
Disclaimer
All information, articles, and product details provided on this website are for general informational and educational purposes only. We do not claim any ownership over, nor do we intend to infringe upon, any trademarks, copyrights, logos, brand names, or other intellectual property mentioned or depicted on this site. Such intellectual property remains the property of its respective owners, and any references here are made solely for identification or informational purposes, without implying any affiliation, endorsement, or partnership.
We make no representations or warranties, express or implied, regarding the accuracy, completeness, or suitability of any content or products presented. Nothing on this website should be construed as legal, tax, investment, financial, medical, or other professional advice. In addition, no part of this site—including articles or product references—constitutes a solicitation, recommendation, endorsement, advertisement, or offer to buy or sell any securities, franchises, or other financial instruments, particularly in jurisdictions where such activity would be unlawful.
All content is of a general nature and may not address the specific circumstances of any individual or entity. It is not a substitute for professional advice or services. Any actions you take based on the information provided here are strictly at your own risk. You accept full responsibility for any decisions or outcomes arising from your use of this website and agree to release us from any liability in connection with your use of, or reliance upon, the content or products found herein.