
|
Lenovo Group Limited (0992.hk) تقييم DCF |
Fully Editable: Tailor To Your Needs In Excel Or Sheets
Professional Design: Trusted, Industry-Standard Templates
Investor-Approved Valuation Models
MAC/PC Compatible, Fully Unlocked
No Expertise Is Needed; Easy To Follow
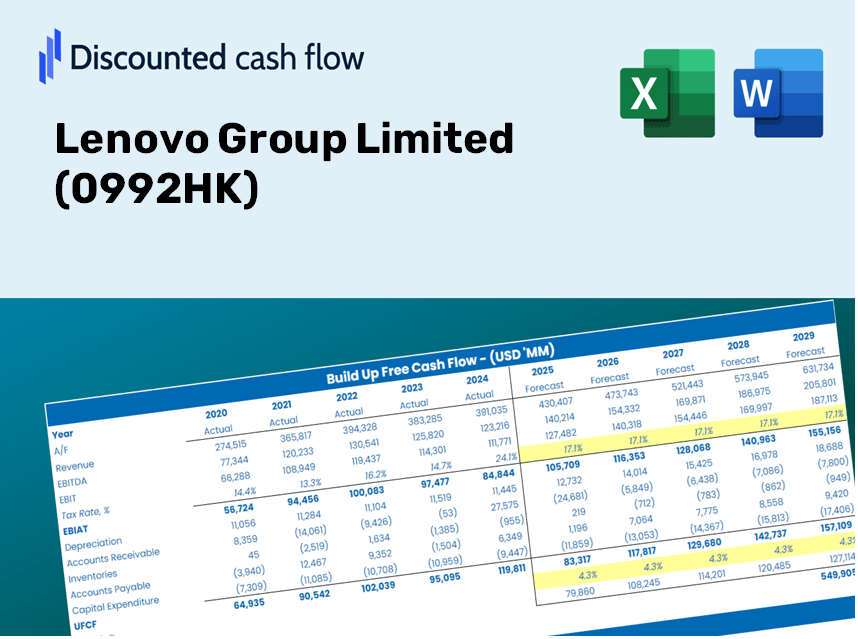
Lenovo Group Limited (0992.HK) Bundle
Optimize your time and improve precision with our (0992HK) DCF Calculator! With real Lenovo data and customizable assumptions, this tool enables you to forecast, analyze, and evaluate Lenovo Group Limited like a seasoned investor.
Discounted Cash Flow (DCF) - (USD MM)
| Year | AY1 2021 |
AY2 2022 |
AY3 2023 |
AY4 2024 |
AY5 2025 |
FY1 2026 |
FY2 2027 |
FY3 2028 |
FY4 2029 |
FY5 2030 |
|---|---|---|---|---|---|---|---|---|---|---|
| Revenue | 472,041.6 | 556,560.6 | 481,402.3 | 441,900.7 | 536,812.0 | 560,530.2 | 585,296.3 | 611,156.7 | 638,159.7 | 666,355.8 |
| Revenue Growth, % | 0 | 17.9 | -13.5 | -8.21 | 21.48 | 4.42 | 4.42 | 4.42 | 4.42 | 4.42 |
| EBITDA | 24,100.3 | 33,803.5 | 32,204.6 | 27,689.9 | 28,521.3 | 33,013.1 | 34,471.8 | 35,994.8 | 37,585.2 | 39,245.9 |
| EBITDA, % | 5.11 | 6.07 | 6.69 | 6.27 | 5.31 | 5.89 | 5.89 | 5.89 | 5.89 | 5.89 |
| Depreciation | 8,214.6 | 9,762.9 | 10,493.7 | 10,981.9 | 11,028.4 | 11,450.3 | 11,956.2 | 12,484.4 | 13,036.0 | 13,612.0 |
| Depreciation, % | 1.74 | 1.75 | 2.18 | 2.49 | 2.05 | 2.04 | 2.04 | 2.04 | 2.04 | 2.04 |
| EBIT | 15,885.7 | 24,040.6 | 21,710.9 | 16,708.0 | 17,492.9 | 21,562.9 | 22,515.6 | 23,510.4 | 24,549.2 | 25,633.8 |
| EBIT, % | 3.37 | 4.32 | 4.51 | 3.78 | 3.26 | 3.85 | 3.85 | 3.85 | 3.85 | 3.85 |
| Total Cash | 23,947.7 | 31,566.1 | 33,581.3 | 27,723.0 | 37,420.3 | 34,713.7 | 36,247.4 | 37,849.0 | 39,521.3 | 41,267.4 |
| Total Cash, percent | .0 | .0 | .0 | .0 | .0 | .0 | .0 | .0 | .0 | .0 |
| Account Receivables | 97,287.4 | 118,424.0 | 79,522.8 | 82,197.7 | 106,904.5 | 108,655.8 | 113,456.6 | 118,469.5 | 123,703.9 | 129,169.6 |
| Account Receivables, % | 20.61 | 21.28 | 16.52 | 18.6 | 19.91 | 19.38 | 19.38 | 19.38 | 19.38 | 19.38 |
| Inventories | 49,584.8 | 64,506.2 | 49,517.1 | 52,087.9 | 61,558.5 | 62,370.4 | 65,126.1 | 68,003.6 | 71,008.3 | 74,145.6 |
| Inventories, % | 10.5 | 11.59 | 10.29 | 11.79 | 11.47 | 11.13 | 11.13 | 11.13 | 11.13 | 11.13 |
| Accounts Payable | 79,428.0 | 102,462.2 | 75,947.6 | 81,639.9 | 93,062.1 | 97,334.4 | 101,634.9 | 106,125.5 | 110,814.5 | 115,710.7 |
| Accounts Payable, % | 16.83 | 18.41 | 15.78 | 18.47 | 17.34 | 17.36 | 17.36 | 17.36 | 17.36 | 17.36 |
| Capital Expenditure | -6,557.0 | -9,978.9 | -12,264.1 | -9,993.0 | -8,945.9 | -10,826.6 | -11,304.9 | -11,804.4 | -12,326.0 | -12,870.6 |
| Capital Expenditure, % | -1.39 | -1.79 | -2.55 | -2.26 | -1.67 | -1.93 | -1.93 | -1.93 | -1.93 | -1.93 |
| Tax Rate, % | 6.51 | 6.51 | 6.51 | 6.51 | 6.51 | 6.51 | 6.51 | 6.51 | 6.51 | 6.51 |
| EBITAT | 10,841.6 | 17,631.1 | 16,341.4 | 12,364.7 | 16,353.9 | 16,575.3 | 17,307.6 | 18,072.3 | 18,870.8 | 19,704.6 |
| Depreciation | ||||||||||
| Changes in Account Receivables | ||||||||||
| Changes in Inventories | ||||||||||
| Changes in Accounts Payable | ||||||||||
| Capital Expenditure | ||||||||||
| UFCF | -54,945.0 | 4,391.3 | 41,946.7 | 13,800.2 | -4,318.7 | 18,908.0 | 14,702.9 | 15,352.5 | 16,030.9 | 16,739.2 |
| WACC, % | 8.35 | 8.5 | 8.56 | 8.52 | 9.11 | 8.61 | 8.61 | 8.61 | 8.61 | 8.61 |
| PV UFCF | ||||||||||
| SUM PV UFCF | 64,453.6 | |||||||||
| Long Term Growth Rate, % | 2.00 | |||||||||
| Free cash flow (T + 1) | 17,074 | |||||||||
| Terminal Value | 258,315 | |||||||||
| Present Terminal Value | 170,925 | |||||||||
| Enterprise Value | 235,378 | |||||||||
| Net Debt | 7,362 | |||||||||
| Equity Value | 228,016 | |||||||||
| Diluted Shares Outstanding, MM | 13,592 | |||||||||
| Equity Value Per Share | 16.78 |
What You'll Receive
- Genuine Lenovo Financials: Comprehensive historical and projected data for precise valuation.
- Customizable Parameters: Adjust WACC, tax rates, revenue growth, and capital expenditures to fit your analysis.
- Automated Calculations: Instantly calculate intrinsic value and NPV as you modify inputs.
- Scenario Analysis: Explore various scenarios to assess Lenovo's future performance.
- User-Friendly Interface: Designed for industry professionals while remaining approachable for newcomers.
Key Features
- Customizable Forecast Inputs: Adjust essential metrics such as revenue growth, EBITDA %, and capital expenditures.
- Instant DCF Valuation: Quickly computes intrinsic value, NPV, and other key outputs.
- High-Precision Results: Leverages Lenovo's real-world financial data for accurate valuation insights.
- Simplified Scenario Analysis: Effortlessly explore various assumptions and assess the resulting impacts.
- Efficiency Boost: Remove the hassle of creating detailed valuation models from the ground up.
How It Works
- Step 1: Download the Excel file.
- Step 2: Review the pre-filled Lenovo data (historical and projected).
- Step 3: Modify key assumptions (highlighted in yellow) according to your analysis.
- Step 4: Observe the automatic recalculations for Lenovo's intrinsic value.
- Step 5: Utilize the results for your investment decisions or reporting.
Why Opt for This Calculator for Lenovo Group Limited (0992HK)?
- Comprehensive Solution: Combines DCF, WACC, and financial ratio analyses all in one user-friendly tool.
- Flexible Inputs: Modify the yellow-highlighted fields to explore a variety of scenarios.
- In-Depth Analysis: Automatically computes Lenovo's intrinsic value and Net Present Value.
- Preloaded Information: Comes with historical and projected data for reliable starting points.
- High-Quality Tool: Perfect for financial analysts, investors, and business consultants working with Lenovo.
Who Can Benefit from This Product?
- Investors: Gain clarity in your investment choices with a professional-grade valuation tool tailored for Lenovo Group Limited (0992HK).
- Financial Analysts: Streamline your workflow with a customizable pre-built DCF model specifically designed for Lenovo Group Limited (0992HK).
- Consultants: Effortlessly modify the template for impactful client presentations or detailed reports related to Lenovo Group Limited (0992HK).
- Finance Enthusiasts: Enhance your grasp of valuation methods through practical, real-world scenarios involving Lenovo Group Limited (0992HK).
- Educators and Students: Utilize this tool as an effective resource for hands-on learning in finance courses focused on Lenovo Group Limited (0992HK).
What the Template Includes
- Comprehensive DCF Model: Editable template featuring detailed valuation calculations.
- Real-World Data: Lenovo Group Limited’s (0992HK) historical and projected financials preloaded for analysis.
- Customizable Parameters: Modify WACC, growth rates, and tax assumptions to explore various scenarios.
- Financial Statements: Complete annual and quarterly breakdowns for enhanced insights.
- Key Ratios: Integrated analysis for assessing profitability, efficiency, and leverage.
- Dashboard with Visual Outputs: Charts and tables that present clear, actionable results.
Disclaimer
All information, articles, and product details provided on this website are for general informational and educational purposes only. We do not claim any ownership over, nor do we intend to infringe upon, any trademarks, copyrights, logos, brand names, or other intellectual property mentioned or depicted on this site. Such intellectual property remains the property of its respective owners, and any references here are made solely for identification or informational purposes, without implying any affiliation, endorsement, or partnership.
We make no representations or warranties, express or implied, regarding the accuracy, completeness, or suitability of any content or products presented. Nothing on this website should be construed as legal, tax, investment, financial, medical, or other professional advice. In addition, no part of this site—including articles or product references—constitutes a solicitation, recommendation, endorsement, advertisement, or offer to buy or sell any securities, franchises, or other financial instruments, particularly in jurisdictions where such activity would be unlawful.
All content is of a general nature and may not address the specific circumstances of any individual or entity. It is not a substitute for professional advice or services. Any actions you take based on the information provided here are strictly at your own risk. You accept full responsibility for any decisions or outcomes arising from your use of this website and agree to release us from any liability in connection with your use of, or reliance upon, the content or products found herein.