
|
Alleima AB (0ABJ.L) تقييم DCF |
Fully Editable: Tailor To Your Needs In Excel Or Sheets
Professional Design: Trusted, Industry-Standard Templates
Investor-Approved Valuation Models
MAC/PC Compatible, Fully Unlocked
No Expertise Is Needed; Easy To Follow
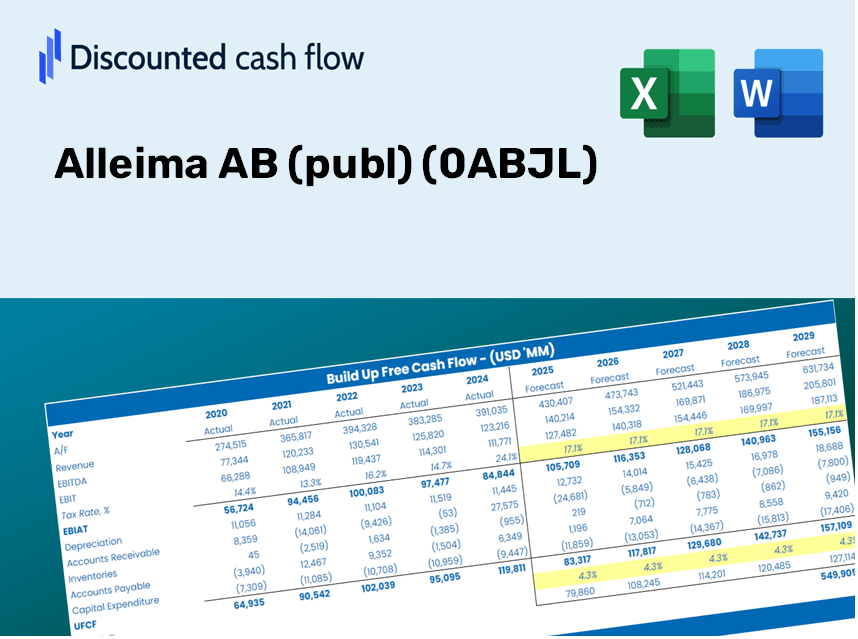
Alleima AB (publ) (0ABJ.L) Bundle
Engineered for accuracy, our (0ABJL) DCF Calculator enables you to evaluate the valuation of Alleima AB (publ) using real-world financial data, while offering complete flexibility to modify all essential parameters for enhanced projections.
Discounted Cash Flow (DCF) - (USD MM)
| Year | AY1 2020 |
AY2 2021 |
AY3 2022 |
AY4 2023 |
AY5 2024 |
FY1 2025 |
FY2 2026 |
FY3 2027 |
FY4 2028 |
FY5 2029 |
|---|---|---|---|---|---|---|---|---|---|---|
| Revenue | 13,925.0 | 13,847.0 | 18,405.0 | 20,669.0 | 19,691.0 | 21,656.5 | 23,818.1 | 26,195.5 | 28,810.2 | 31,685.9 |
| Revenue Growth, % | 0 | -0.56014 | 32.92 | 12.3 | -4.73 | 9.98 | 9.98 | 9.98 | 9.98 | 9.98 |
| EBITDA | 1,247.0 | 2,427.0 | 2,840.0 | 3,060.0 | 2,534.0 | 3,014.0 | 3,314.8 | 3,645.7 | 4,009.6 | 4,409.8 |
| EBITDA, % | 8.96 | 17.53 | 15.43 | 14.8 | 12.87 | 13.92 | 13.92 | 13.92 | 13.92 | 13.92 |
| Depreciation | 790.0 | 840.0 | 859.0 | 911.0 | 913.0 | 1,102.4 | 1,212.4 | 1,333.4 | 1,466.5 | 1,612.9 |
| Depreciation, % | 5.67 | 6.07 | 4.67 | 4.41 | 4.64 | 5.09 | 5.09 | 5.09 | 5.09 | 5.09 |
| EBIT | 457.0 | 1,587.0 | 1,981.0 | 2,149.0 | 1,621.0 | 1,911.6 | 2,102.5 | 2,312.3 | 2,543.1 | 2,797.0 |
| EBIT, % | 3.28 | 11.46 | 10.76 | 10.4 | 8.23 | 8.83 | 8.83 | 8.83 | 8.83 | 8.83 |
| Total Cash | 179.0 | 1,661.0 | 892.0 | 1,595.0 | 1,912.0 | 1,540.0 | 1,693.7 | 1,862.7 | 2,048.6 | 2,253.1 |
| Total Cash, percent | .0 | .0 | .0 | .0 | .0 | .0 | .0 | .0 | .0 | .0 |
| Account Receivables | 1,872.0 | 2,740.0 | 3,260.0 | 2,960.0 | 3,294.0 | 3,551.4 | 3,905.8 | 4,295.7 | 4,724.5 | 5,196.1 |
| Account Receivables, % | 13.44 | 19.79 | 17.71 | 14.32 | 16.73 | 16.4 | 16.4 | 16.4 | 16.4 | 16.4 |
| Inventories | 4,296.0 | 5,372.0 | 7,355.0 | 7,360.0 | 7,432.0 | 7,924.5 | 8,715.5 | 9,585.5 | 10,542.3 | 11,594.5 |
| Inventories, % | 30.85 | 38.8 | 39.96 | 35.61 | 37.74 | 36.59 | 36.59 | 36.59 | 36.59 | 36.59 |
| Accounts Payable | 1,192.0 | 2,128.0 | 2,619.0 | 2,003.0 | 2,249.0 | 2,567.2 | 2,823.4 | 3,105.2 | 3,415.2 | 3,756.1 |
| Accounts Payable, % | 8.56 | 15.37 | 14.23 | 9.69 | 11.42 | 11.85 | 11.85 | 11.85 | 11.85 | 11.85 |
| Capital Expenditure | -519.0 | -494.0 | -678.0 | -827.0 | -1,195.0 | -911.7 | -1,002.7 | -1,102.7 | -1,212.8 | -1,333.9 |
| Capital Expenditure, % | -3.73 | -3.57 | -3.68 | -4 | -6.07 | -4.21 | -4.21 | -4.21 | -4.21 | -4.21 |
| Tax Rate, % | 22.28 | 22.28 | 22.28 | 22.28 | 22.28 | 22.28 | 22.28 | 22.28 | 22.28 | 22.28 |
| EBITAT | 320.6 | 1,269.8 | 1,502.6 | 1,630.9 | 1,259.9 | 1,451.4 | 1,596.3 | 1,755.6 | 1,930.8 | 2,123.6 |
| Depreciation | ||||||||||
| Changes in Account Receivables | ||||||||||
| Changes in Inventories | ||||||||||
| Changes in Accounts Payable | ||||||||||
| Capital Expenditure | ||||||||||
| UFCF | -4,384.4 | 607.8 | -328.4 | 1,393.9 | 817.9 | 1,210.3 | 916.8 | 1,008.3 | 1,108.9 | 1,219.6 |
| WACC, % | 9.01 | 9.04 | 9.03 | 9.03 | 9.03 | 9.03 | 9.03 | 9.03 | 9.03 | 9.03 |
| PV UFCF | ||||||||||
| SUM PV UFCF | 4,236.0 | |||||||||
| Long Term Growth Rate, % | 2.00 | |||||||||
| Free cash flow (T + 1) | 1,244 | |||||||||
| Terminal Value | 17,705 | |||||||||
| Present Terminal Value | 11,493 | |||||||||
| Enterprise Value | 15,729 | |||||||||
| Net Debt | -1,451 | |||||||||
| Equity Value | 17,180 | |||||||||
| Diluted Shares Outstanding, MM | 251 | |||||||||
| Equity Value Per Share | 68.48 |
What You Will Receive
- Genuine Alleima Data: Comprehensive financials – encompassing revenue to EBIT – derived from actual and projected statistics.
- Complete Customization: Modify all essential parameters (yellow cells) including WACC, growth %, and tax rates.
- Instant Valuation Adjustments: Automatic recalculations to assess the effects of changes on Alleima’s fair value.
- Flexible Excel Template: Designed for easy edits, scenario analysis, and in-depth projections.
- Time-Efficient and Reliable: Avoid starting models from scratch while ensuring accuracy and adaptability.
Key Features
- Pre-Loaded Data: Alleima AB’s historical financial statements and pre-filled forecasts.
- Fully Adjustable Inputs: Customize WACC, tax rates, revenue growth, and EBITDA margins.
- Instant Results: Watch Alleima AB’s intrinsic value recalculate in real time.
- Clear Visual Outputs: Dashboard charts present valuation results and key metrics.
- Built for Accuracy: A professional tool designed for analysts, investors, and finance experts.
How It Functions
- Download: Obtain the pre-configured Excel file containing Alleima AB's (0ABJL) financial data.
- Customize: Modify forecasts such as revenue growth, EBITDA %, and WACC to fit your analysis.
- Update Automatically: Watch as the intrinsic value and NPV calculations refresh in real-time.
- Test Scenarios: Generate various projections and instantly compare the results.
- Make Decisions: Utilize the valuation insights to inform your investment strategy.
Why Choose This Calculator for Alleima AB (publ) (0ABJL)?
- Designed for Experts: A sophisticated tool tailored for analysts, CFOs, and consultants in the industry.
- Accurate Financials: Historical and projected financial data for Alleima AB seamlessly integrated for precision.
- Flexible Scenario Analysis: Effortlessly explore various forecasts and underlying assumptions.
- Comprehensive Outputs: Instantly computes intrinsic value, NPV, and essential financial metrics.
- User-Friendly: Easy-to-follow instructions ensure a smooth experience throughout the calculation process.
Who Should Use This Product?
- Individual Investors: Make informed decisions about buying or selling Alleima AB (publ) (0ABJL) stock.
- Financial Analysts: Enhance valuation processes with ready-to-use financial models specific to Alleima AB (publ) (0ABJL).
- Consultants: Provide clients with professional valuation insights on Alleima AB (publ) (0ABJL) swiftly and accurately.
- Business Owners: Gain an understanding of how companies like Alleima AB (publ) (0ABJL) are valued to inform your strategic decisions.
- Finance Students: Master valuation techniques using real-world data and scenarios involving Alleima AB (publ) (0ABJL).
Contents of the Template
- In-Depth DCF Model: Editable template featuring comprehensive valuation calculations.
- Actual Financial Data: Alleima AB's (0ABJL) historical and forecasted financials preloaded for your analysis.
- Adjustable Parameters: Modify WACC, growth rates, and tax assumptions to explore different scenarios.
- Financial Statements: Complete annual and quarterly breakdowns for thorough insights.
- Essential Ratios: Integrated analysis for measuring profitability, efficiency, and leverage.
- Interactive Dashboard with Visual Outputs: Graphs and tables to present clear, actionable results.
Disclaimer
All information, articles, and product details provided on this website are for general informational and educational purposes only. We do not claim any ownership over, nor do we intend to infringe upon, any trademarks, copyrights, logos, brand names, or other intellectual property mentioned or depicted on this site. Such intellectual property remains the property of its respective owners, and any references here are made solely for identification or informational purposes, without implying any affiliation, endorsement, or partnership.
We make no representations or warranties, express or implied, regarding the accuracy, completeness, or suitability of any content or products presented. Nothing on this website should be construed as legal, tax, investment, financial, medical, or other professional advice. In addition, no part of this site—including articles or product references—constitutes a solicitation, recommendation, endorsement, advertisement, or offer to buy or sell any securities, franchises, or other financial instruments, particularly in jurisdictions where such activity would be unlawful.
All content is of a general nature and may not address the specific circumstances of any individual or entity. It is not a substitute for professional advice or services. Any actions you take based on the information provided here are strictly at your own risk. You accept full responsibility for any decisions or outcomes arising from your use of this website and agree to release us from any liability in connection with your use of, or reliance upon, the content or products found herein.