
|
Nexus AG (0fgl.l) تقييم DCF |
Fully Editable: Tailor To Your Needs In Excel Or Sheets
Professional Design: Trusted, Industry-Standard Templates
Investor-Approved Valuation Models
MAC/PC Compatible, Fully Unlocked
No Expertise Is Needed; Easy To Follow
Nexus AG (0FGL.L) Bundle
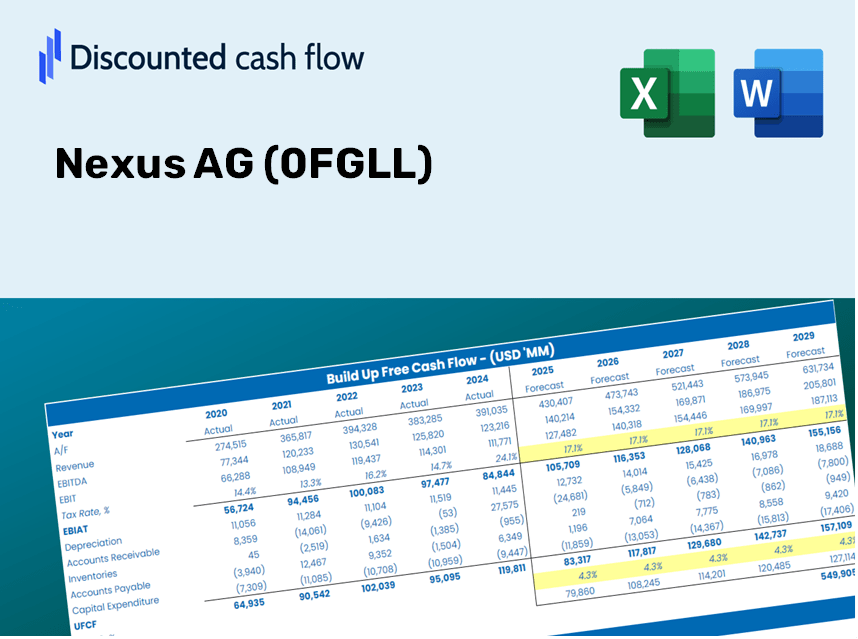
Gain insights into Nexus AG (0FGLL) valuation analysis with our state-of-the-art DCF Calculator! Preloaded with real (0FGLL) data, this Excel template enables you to adjust forecasts and assumptions to accurately determine Nexus AG's intrinsic value.
Benefits of Choosing Nexus AG (0FGLL)
- Comprehensive Financial Model: Utilize actual data from Nexus AG for accurate DCF valuation.
- Complete Forecasting Control: Modify growth rates, profit margins, WACC, and other essential parameters.
- Real-Time Calculations: Automatic updates provide immediate insights as you make adjustments.
- Professional-Grade Template: An optimized Excel file created for high-quality valuation purposes.
- Flexible and Reusable: Designed for adaptability, allowing for repeated application in detailed forecasting.
Key Features
- Real-Time Nexus AG Data: Pre-populated with Nexus AG’s historical financial performance and future forecasts.
- Customizable Metrics: Tailor inputs for revenue growth, profit margins, WACC, tax rates, and capital expenditures.
- Responsive Valuation Framework: Automatic recalculations of Net Present Value (NPV) and intrinsic value based on your adjustments.
- Scenario Analysis: Develop various forecasting scenarios to explore different valuation possibilities.
- User-Centric Interface: Intuitive and organized, catering to both seasoned professionals and newcomers.
How It Functions
- Download: Obtain the pre-formatted Excel file containing Nexus AG's (0FGLL) financial data.
- Customize: Modify projections such as revenue growth, EBITDA %, and WACC to fit your analysis.
- Auto-Update: The calculations for intrinsic value and NPV refresh in real-time.
- Scenario Analysis: Generate various projections and instantly compare the results.
- Informed Decisions: Leverage the valuation insights to shape your investment approach.
Why Choose This Calculator for Nexus AG (0FGLL)?
- User-Friendly Design: Ideal for both novices and seasoned analysts.
- Customizable Parameters: Modify inputs effortlessly to suit your analysis needs.
- Real-Time Feedback: Witness immediate updates to Nexus AG’s valuation as you change inputs.
- Preloaded Data: Comes equipped with actual financial information for swift analysis.
- Endorsed by Experts: A go-to tool for investors and analysts aiming to make educated decisions.
Who Can Benefit from Nexus AG (0FGLL)?
- Finance Students: Master valuation methodologies and apply them to real-world scenarios.
- Academics: Integrate industry-standard models into your teaching or research efforts.
- Investors: Challenge your assumptions and evaluate valuation results for Nexus AG (0FGLL).
- Analysts: Enhance your efficiency with a ready-to-use, customizable DCF model.
- Small Business Owners: Learn how analysts evaluate large public companies like Nexus AG (0FGLL).
Contents of the Nexus AG Template
- Preloaded NXG Data: Historical and forecasted financial metrics, including revenue, EBIT, and capital expenditures.
- DCF and WACC Models: Advanced spreadsheets designed for calculating intrinsic value and Weighted Average Cost of Capital.
- Editable Inputs: Cells highlighted in yellow for modifying revenue growth rates, tax rates, and discount rates.
- Financial Statements: Detailed annual and quarterly financial reports for in-depth analysis.
- Key Ratios: Metrics on profitability, leverage, and efficiency for performance assessment.
- Dashboard and Charts: Visual representations of valuation results and underlying assumptions.
Disclaimer
All information, articles, and product details provided on this website are for general informational and educational purposes only. We do not claim any ownership over, nor do we intend to infringe upon, any trademarks, copyrights, logos, brand names, or other intellectual property mentioned or depicted on this site. Such intellectual property remains the property of its respective owners, and any references here are made solely for identification or informational purposes, without implying any affiliation, endorsement, or partnership.
We make no representations or warranties, express or implied, regarding the accuracy, completeness, or suitability of any content or products presented. Nothing on this website should be construed as legal, tax, investment, financial, medical, or other professional advice. In addition, no part of this site—including articles or product references—constitutes a solicitation, recommendation, endorsement, advertisement, or offer to buy or sell any securities, franchises, or other financial instruments, particularly in jurisdictions where such activity would be unlawful.
All content is of a general nature and may not address the specific circumstances of any individual or entity. It is not a substitute for professional advice or services. Any actions you take based on the information provided here are strictly at your own risk. You accept full responsibility for any decisions or outcomes arising from your use of this website and agree to release us from any liability in connection with your use of, or reliance upon, the content or products found herein.