
|
شركة Lecron Industrial Development Group ، Ltd. (300343.SZ) تقييم DCF |
Fully Editable: Tailor To Your Needs In Excel Or Sheets
Professional Design: Trusted, Industry-Standard Templates
Investor-Approved Valuation Models
MAC/PC Compatible, Fully Unlocked
No Expertise Is Needed; Easy To Follow
Lecron Industrial Development Group Co., Ltd. (300343.SZ) Bundle
تقييم التوقعات المالية لشركة Lecron Industrial Development Group ، Ltd. كخبير! توفر حاسبة DCF (300343SZ) بيانات مالية مملوءة مسبقًا ومرونة كاملة لتعديل نمو الإيرادات ، WACC ، الهوامش ، وغيرها من الافتراضات الأساسية التي تتماشى مع توقعاتك.
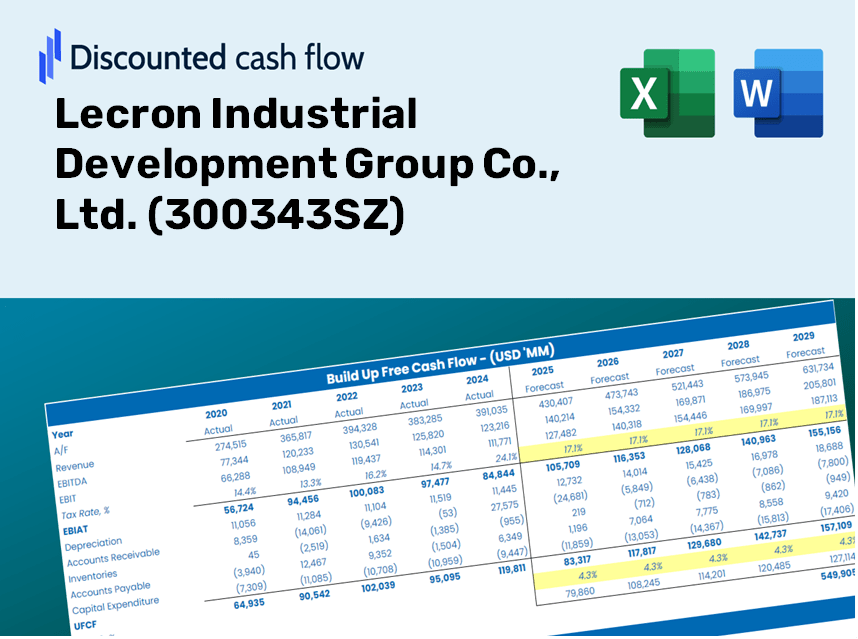
Discounted Cash Flow (DCF) - (USD MM)
| Year | AY1 2020 |
AY2 2021 |
AY3 2022 |
AY4 2023 |
AY5 2024 |
FY1 2025 |
FY2 2026 |
FY3 2027 |
FY4 2028 |
FY5 2029 |
|---|---|---|---|---|---|---|---|---|---|---|
| Revenue | 1,738.4 | 1,835.1 | 2,062.7 | 1,035.6 | 868.7 | 764.6 | 673.0 | 592.3 | 521.3 | 458.8 |
| Revenue Growth, % | 0 | 5.56 | 12.4 | -49.79 | -16.11 | -11.99 | -11.99 | -11.99 | -11.99 | -11.99 |
| EBITDA | -20.8 | 445.2 | 949.8 | 120.5 | 97.0 | 140.6 | 123.7 | 108.9 | 95.8 | 84.3 |
| EBITDA, % | -1.2 | 24.26 | 46.05 | 11.63 | 11.16 | 18.38 | 18.38 | 18.38 | 18.38 | 18.38 |
| Depreciation | 64.0 | 69.2 | 76.0 | 74.1 | 78.4 | 41.8 | 36.8 | 32.4 | 28.5 | 25.1 |
| Depreciation, % | 3.68 | 3.77 | 3.68 | 7.15 | 9.03 | 5.46 | 5.46 | 5.46 | 5.46 | 5.46 |
| EBIT | -84.8 | 376.0 | 873.8 | 46.4 | 18.5 | 98.8 | 86.9 | 76.5 | 67.3 | 59.3 |
| EBIT, % | -4.88 | 20.49 | 42.37 | 4.48 | 2.13 | 12.92 | 12.92 | 12.92 | 12.92 | 12.92 |
| Total Cash | 373.8 | 295.7 | 1,104.6 | 1,206.1 | 626.2 | 402.6 | 354.3 | 311.9 | 274.5 | 241.6 |
| Total Cash, percent | .0 | .0 | .0 | .0 | .0 | .0 | .0 | .0 | .0 | .0 |
| Account Receivables | 505.6 | 591.1 | 714.8 | 299.0 | 486.1 | 276.4 | 243.3 | 214.2 | 188.5 | 165.9 |
| Account Receivables, % | 29.08 | 32.21 | 34.65 | 28.87 | 55.96 | 36.15 | 36.15 | 36.15 | 36.15 | 36.15 |
| Inventories | 101.2 | 161.1 | 227.2 | 140.7 | 147.2 | 85.9 | 75.6 | 66.5 | 58.5 | 51.5 |
| Inventories, % | 5.82 | 8.78 | 11.02 | 13.58 | 16.95 | 11.23 | 11.23 | 11.23 | 11.23 | 11.23 |
| Accounts Payable | 288.7 | 241.1 | 384.2 | 445.1 | 197.4 | 174.5 | 153.5 | 135.1 | 118.9 | 104.7 |
| Accounts Payable, % | 16.61 | 13.14 | 18.63 | 42.98 | 22.72 | 22.82 | 22.82 | 22.82 | 22.82 | 22.82 |
| Capital Expenditure | -50.2 | -27.3 | -82.3 | -43.2 | -17.1 | -22.2 | -19.5 | -17.2 | -15.1 | -13.3 |
| Capital Expenditure, % | -2.89 | -1.49 | -3.99 | -4.18 | -1.97 | -2.9 | -2.9 | -2.9 | -2.9 | -2.9 |
| Tax Rate, % | -48.45 | -48.45 | -48.45 | -48.45 | -48.45 | -48.45 | -48.45 | -48.45 | -48.45 | -48.45 |
| EBITAT | -70.6 | 295.6 | 658.4 | 16.6 | 27.5 | 73.7 | 64.9 | 57.1 | 50.2 | 44.2 |
| Depreciation | ||||||||||
| Changes in Account Receivables | ||||||||||
| Changes in Inventories | ||||||||||
| Changes in Accounts Payable | ||||||||||
| Capital Expenditure | ||||||||||
| UFCF | -374.9 | 144.7 | 605.3 | 610.7 | -352.6 | 341.4 | 104.6 | 92.1 | 81.0 | 71.3 |
| WACC, % | 4.56 | 4.55 | 4.55 | 4.52 | 4.57 | 4.55 | 4.55 | 4.55 | 4.55 | 4.55 |
| PV UFCF | ||||||||||
| SUM PV UFCF | 627.7 | |||||||||
| Long Term Growth Rate, % | 0.50 | |||||||||
| Free cash flow (T + 1) | 72 | |||||||||
| Terminal Value | 1,770 | |||||||||
| Present Terminal Value | 1,417 | |||||||||
| Enterprise Value | 2,045 | |||||||||
| Net Debt | -153 | |||||||||
| Equity Value | 2,198 | |||||||||
| Diluted Shares Outstanding, MM | 1,088 | |||||||||
| Equity Value Per Share | 2.02 |
الفوائد التي ستتلقاها
- بيانات مالية شاملة (300343SZ): تم تحميله مسبقًا بأرقام Lecron Industrial Development Group التاريخية والمتوقعة للتحليل الدقيق.
- قالب قابل للتخصيص: بسهولة ضبط المتغيرات الرئيسية مثل نمو الإيرادات ، WACC ، والنسب المئوية EBITDA.
- الحسابات الفورية: شاهد كقيمة جوهرية لتحديثات (300343SZ) في الوقت الفعلي مع تعديلاتك.
- أداة تقييم الخبراء: مصمم للمستثمرين والمحللين والمستشارين الذين يبحثون عن نتائج DCF موثوقة.
- التصميم البديهي: تصميم مباشر مع إرشادات واضحة مناسبة للمستخدمين من جميع مستويات الخبرة.
الميزات الرئيسية
- 🔍 البيانات المالية (300343SZ) المالية: بيانات تاريخية ومتوقعة شاملة لشركة Lecron Industrial Development Group ، Ltd.
- ✏️ مدخلات قابلة للتخصيص بالكامل: تعديل المعلمات الأساسية (الخلايا الصفراء) مثل WACC ، نسب النمو ، ومعدلات الضرائب.
- 📊 تقييم DCF المهني: تقيم الصيغ المتكاملة القيمة الجوهرية لـ Lecron باستخدام طريقة التدفق النقدي المخفض.
- ⚡ النتائج الفورية: عرض تقييم Lecron مباشرة بعد التعديلات.
- تحليل السيناريو: تقييم النتائج والتباين لافتراضات مالية مختلفة جنبًا إلى جنب.
كيف تعمل
- الخطوة 1: قم بتنزيل ملف Excel لـ Lecron Industrial Development Group Co. ، Ltd. (300343SZ).
- الخطوة 2: فحص البيانات المالية المملوءة مسبقًا وإسقاطات Lecron.
- الخطوة 3: اضبط المتغيرات الرئيسية مثل نمو الإيرادات و WACC ومعدلات الضرائب (الخلايا المميزة).
- الخطوة 4: راقب تحديث نموذج DCF في الوقت الفعلي أثناء تعديل افتراضاتك.
- الخطوة 5: راجع النتائج واستخدم المخرجات لقرارات الاستثمار المستنيرة.
لماذا تختار حاسبة مجموعة Lecron Industrial Development Group؟
- حل الكل في واحد: يجمع بين تحليلات DCF و WACC والنسبة المالية المصممة خصيصًا لمجموعة Lecron Industrial Development Group (300343SZ).
- مدخلات مرنة: تعديل الخلايا المميزة لاستكشاف سيناريوهات مالية مختلفة.
- تحليل متعمق: يحسب تلقائيًا القيمة الجوهرية وصافي القيمة الحالية لمجموعة Lecron Industrial Development.
- المعلومات المحملة مسبقًا: يقدم بيانات تاريخية ومتوقعة لتوفير نقاط انطلاق موثوقة للتحليل.
- جودة استثنائية: مثالي للمحللين الماليين والمستثمرين ومستشاري الأعمال الذين يركزون على مجموعة Lecron Industrial Development Group (300343SZ).
من يمكنه الاستفادة من شركة Lecron Industrial Development Group ، Ltd. (300343SZ)؟
- المستثمرون: اكتساب الثقة في اختيارات الاستثمار الخاصة بك مع أدوات التقييم المتقدمة لدينا.
- المحللون الماليون: قم بتبسيط سير العمل الخاص بك باستخدام نموذج DCF القابل للتخصيص ، المصمم للكفاءة.
- الاستشاريون: تخصيص قوالبنا لعروض العميل المؤثرة أو التقارير التفصيلية.
- عشاق المالية: عزز معرفتك بممارسات التقييم من خلال أمثلة عملية في العالم الحقيقي.
- المعلمون والطلاب: الاستفادة من مواردنا كمساعدات تعليمية فعالة في دورات التمويل.
محتويات القالب
- البيانات التاريخية: تضم شركة Lecron Industrial Development Group Co. ، Ltd. الأداء المالي السابق والتوقعات التأسيسية.
- نماذج DCF و Ruvered DCF: قوالب شاملة لتحديد القيمة الجوهرية لشركة Lecron Industrial Development Group ، Ltd. (300343SZ).
- ورقة WACC: الحسابات المسببة للتشكيل لمتوسط تكلفة رأس المال المرجح.
- مدخلات قابلة للتحرير: اضبط برامج التشغيل المحورية مثل معدلات النمو ونسب EBITDA وافتراضات Capex.
- البيانات الفصلية والسنوية: انهيار واسع النطاق لشركة Lecron Industrial Development Group ، Ltd.
- لوحة القيادة التفاعلية: واجهة ديناميكية لتصور نتائج التقييم والإسقاطات.
Disclaimer
All information, articles, and product details provided on this website are for general informational and educational purposes only. We do not claim any ownership over, nor do we intend to infringe upon, any trademarks, copyrights, logos, brand names, or other intellectual property mentioned or depicted on this site. Such intellectual property remains the property of its respective owners, and any references here are made solely for identification or informational purposes, without implying any affiliation, endorsement, or partnership.
We make no representations or warranties, express or implied, regarding the accuracy, completeness, or suitability of any content or products presented. Nothing on this website should be construed as legal, tax, investment, financial, medical, or other professional advice. In addition, no part of this site—including articles or product references—constitutes a solicitation, recommendation, endorsement, advertisement, or offer to buy or sell any securities, franchises, or other financial instruments, particularly in jurisdictions where such activity would be unlawful.
All content is of a general nature and may not address the specific circumstances of any individual or entity. It is not a substitute for professional advice or services. Any actions you take based on the information provided here are strictly at your own risk. You accept full responsibility for any decisions or outcomes arising from your use of this website and agree to release us from any liability in connection with your use of, or reliance upon, the content or products found herein.