
|
Jiangxi Fushine Pharmaceutical Co. ، Ltd. (300497.SZ) تقييم DCF |
Fully Editable: Tailor To Your Needs In Excel Or Sheets
Professional Design: Trusted, Industry-Standard Templates
Investor-Approved Valuation Models
MAC/PC Compatible, Fully Unlocked
No Expertise Is Needed; Easy To Follow
Jiangxi Fushine Pharmaceutical Co., Ltd. (300497.SZ) Bundle
تبسيط Jiangxi Fushine Pharmaceutical Co. ، Ltd. (300497SZ) تقييم مع هذه الآلة الحاسبة DCF القابلة للتخصيص! يضم شركة Jiangxi Fushine Pharmaceutical Co. ، Ltd. (300497SZ) والمدخلات المالية القابلة للتعديل ، يمكنك اختبار السيناريوهات وكشف Jiangxi Fushine Pharmaceutical Co. ، Ltd. (300497SZ) القيمة العادلة في دقائق.
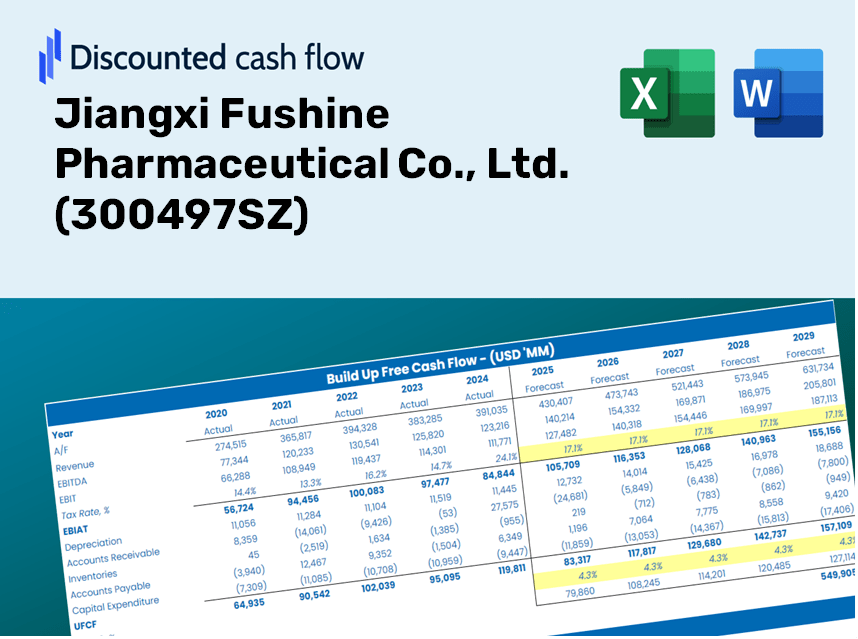
Discounted Cash Flow (DCF) - (USD MM)
| Year | AY1 2020 |
AY2 2021 |
AY3 2022 |
AY4 2023 |
AY5 2024 |
FY1 2025 |
FY2 2026 |
FY3 2027 |
FY4 2028 |
FY5 2029 |
|---|---|---|---|---|---|---|---|---|---|---|
| Revenue | 1,493.0 | 1,429.5 | 1,647.3 | 1,609.7 | 1,177.8 | 1,124.5 | 1,073.5 | 1,024.9 | 978.4 | 934.1 |
| Revenue Growth, % | 0 | -4.25 | 15.23 | -2.28 | -26.83 | -4.53 | -4.53 | -4.53 | -4.53 | -4.53 |
| EBITDA | 476.5 | 178.6 | 22.2 | -31.7 | -76.9 | 83.8 | 80.0 | 76.4 | 72.9 | 69.6 |
| EBITDA, % | 31.92 | 12.49 | 1.35 | -1.97 | -6.53 | 7.45 | 7.45 | 7.45 | 7.45 | 7.45 |
| Depreciation | 74.5 | 97.6 | 121.7 | 159.5 | 171.1 | 98.2 | 93.7 | 89.5 | 85.4 | 81.5 |
| Depreciation, % | 4.99 | 6.83 | 7.39 | 9.91 | 14.53 | 8.73 | 8.73 | 8.73 | 8.73 | 8.73 |
| EBIT | 402.0 | 80.9 | -99.5 | -191.1 | -248.0 | -14.4 | -13.7 | -13.1 | -12.5 | -11.9 |
| EBIT, % | 26.92 | 5.66 | -6.04 | -11.87 | -21.05 | -1.28 | -1.28 | -1.28 | -1.28 | -1.28 |
| Total Cash | 1,691.9 | 1,423.2 | 1,027.8 | 731.6 | 697.5 | 824.5 | 787.1 | 751.5 | 717.4 | 684.9 |
| Total Cash, percent | .0 | .0 | .0 | .0 | .0 | .0 | .0 | .0 | .0 | .0 |
| Account Receivables | 330.8 | 385.2 | 552.5 | 615.4 | 526.2 | 372.3 | 355.4 | 339.3 | 324.0 | 309.3 |
| Account Receivables, % | 22.15 | 26.95 | 33.54 | 38.23 | 44.67 | 33.11 | 33.11 | 33.11 | 33.11 | 33.11 |
| Inventories | 288.0 | 416.1 | 553.7 | 434.7 | 421.1 | 325.6 | 310.8 | 296.7 | 283.3 | 270.4 |
| Inventories, % | 19.29 | 29.11 | 33.61 | 27 | 35.75 | 28.95 | 28.95 | 28.95 | 28.95 | 28.95 |
| Accounts Payable | 418.6 | 517.0 | 603.8 | 581.9 | 603.4 | 423.3 | 404.2 | 385.8 | 368.4 | 351.7 |
| Accounts Payable, % | 28.04 | 36.17 | 36.66 | 36.15 | 51.23 | 37.65 | 37.65 | 37.65 | 37.65 | 37.65 |
| Capital Expenditure | -449.2 | -679.6 | -459.4 | -242.2 | -141.7 | -298.2 | -284.7 | -271.8 | -259.5 | -247.7 |
| Capital Expenditure, % | -30.09 | -47.54 | -27.89 | -15.05 | -12.03 | -26.52 | -26.52 | -26.52 | -26.52 | -26.52 |
| Tax Rate, % | 5.71 | 5.71 | 5.71 | 5.71 | 5.71 | 5.71 | 5.71 | 5.71 | 5.71 | 5.71 |
| EBITAT | 338.8 | 71.8 | -98.7 | -164.6 | -233.8 | -13.0 | -12.4 | -11.8 | -11.3 | -10.8 |
| Depreciation | ||||||||||
| Changes in Account Receivables | ||||||||||
| Changes in Inventories | ||||||||||
| Changes in Accounts Payable | ||||||||||
| Capital Expenditure | ||||||||||
| UFCF | -236.0 | -594.4 | -654.4 | -213.2 | -80.2 | -143.7 | -191.0 | -182.3 | -174.0 | -166.2 |
| WACC, % | 5.98 | 6.01 | 6.09 | 5.99 | 6.05 | 6.02 | 6.02 | 6.02 | 6.02 | 6.02 |
| PV UFCF | ||||||||||
| SUM PV UFCF | -720.2 | |||||||||
| Long Term Growth Rate, % | 4.00 | |||||||||
| Free cash flow (T + 1) | -173 | |||||||||
| Terminal Value | -8,537 | |||||||||
| Present Terminal Value | -6,372 | |||||||||
| Enterprise Value | -7,093 | |||||||||
| Net Debt | 598 | |||||||||
| Equity Value | -7,690 | |||||||||
| Diluted Shares Outstanding, MM | 534 | |||||||||
| Equity Value Per Share | -14.41 |
ماذا ستكسب
- بيانات الإفوشين الأصلية: البيانات المالية الشاملة - بما في ذلك الإيرادات و EBIT - يتم الحصول عليها من كل من الأرقام الفعلية والمتوقعة.
- التخصيص الكامل: قم بتعديل جميع المعلمات الرئيسية (الخلايا المميزة) مثل WACC و Growth ٪ ومعدلات الضرائب.
- تحديثات التقييم الفوري: عمليات إعادة حساب تلقائية لتقييم تأثير التغييرات على القيمة العادلة لفوشين.
- قالب Excel المرن: تم تصميمه للتعديلات السريعة ، وتحليل السيناريو ، والتوقعات المتعمقة.
- كفاءة وموثوقة: تجنب متاعب بناء نماذج من الألف إلى الياء مع ضمان الدقة والقدرة على التكيف.
الميزات الرئيسية
- 🔍 البيانات المالية (300497SZ) المالية: البيانات التاريخية والمتوقعة المليئة مسبقًا لشركة Jiangxi Fushine Pharmaceutical Co. ، Ltd.
- ✏️ مدخلات قابلة للتخصيص بالكامل: اضبط جميع المعلمات الرئيسية (الخلايا الصفراء) مثل WACC و Growth ٪ ومعدلات الضرائب.
- 📊 تقييم DCF المهني: الصيغ المتكاملة تحسب القيمة الجوهرية لـ Jiangxi Fushine باستخدام طريقة التدفق النقدي المخفض.
- ⚡ النتائج الفورية: تصور تقييم Jiangxi Fushine على الفور بعد إجراء التعديلات.
- تحليل السيناريو: استكشاف وقارن الافتراضات المالية المتنوعة جنبًا إلى جنب.
كيف تعمل
- قم بتنزيل القالب: الحصول على وصول فوري إلى حاسبة JFP DCF المستندة إلى Excel لشركة Jiangxi Fushine Pharmaceutical Co. ، Ltd. (300497SZ).
- أدخل افتراضاتك: تعديل الخلايا ذات الضوء الصفراء لتعيين معدلات النمو الخاصة بك ، WACC ، الهوامش ، والمتغيرات الأخرى.
- الحسابات الفورية: سيعكس النموذج تلقائيًا القيمة الجوهرية لشركة Jiangxi Fushine Pharmaceutical Co. ، Ltd. (300497SZ).
- سيناريوهات الاختبار: تجربة الافتراضات المختلفة لتقييم التغييرات المحتملة في التقييم.
- تحليل وتحديد: الاستفادة من النتائج لإبلاغ استراتيجية الاستثمار أو التحليل المالي.
لماذا تختار حاسبة Jiangxi Fushine Pharmaceutical؟
- حل الكل في واحد: ميزات DCF ، WACC ، وتحليلات نسبة مالية شاملة في أداة واحدة.
- خيارات الإدخال المرنة: تعديل الخلايا ذات الضوء الصفراء لاستكشاف سيناريوهات مالية مختلفة.
- تحليل متعمق: يحسب تلقائيًا القيمة الجوهرية والقيمة الحالية الصافية لـ Jiangxi Fushine Pharmaceutical (300497SZ).
- قاعدة بيانات غنية: يأتي مع بيانات تاريخية ومتوقعة لتوفير أسس موثوقة للحسابات.
- جودة من فئة الخبراء: مثالي للمحللين الماليين والمستثمرين ومستشاري الأعمال الذين يركزون على أسواق الأدوية.
من يمكنه الاستفادة من هذا المنتج؟
- المستثمرون الأفراد: اتخاذ قرارات مستنيرة بشأن شراء أو بيع Jiangxi Fushine Pharmaceutical Co. ، Ltd. (300497SZ).
- المحللون الماليون: تحسين عمليات التقييم مع نماذج مالية سهلة الاستخدام مصممة خصيصًا لشركة Jiangxi Fushine Pharmaceutical Co. ، Ltd. (300497SZ).
- الاستشاريون: تزويد العملاء برؤى تقييم سريعة ودقيقة خاصة بـ Jiangxi Fushine Pharmaceutical Co. ، Ltd. (300497SZ).
- أصحاب الأعمال: اكتساب رؤى حول كيفية تقدير شركات مثل Jiangxi Fushine Pharmaceutical Co. ، Ltd. (300497SZ) لإبلاغ استراتيجيات عملك.
- طلاب التمويل: استكشف تقنيات التقييم من خلال عدسة سيناريوهات العالم الحقيقي التي تشمل Jiangxi Fushine Pharmaceutical Co. ، Ltd. (300497SZ).
محتويات القالب
- البيانات المليئة مسبقا: يحتوي على بيانات وتوقعات مالية تاريخية لشركة Jiangxi Fushine Pharmaceutical Co. ، Ltd. (300497SZ).
- نموذج التدفق النقدي المخفض: نموذج تقييم DCF قابل للتحرير يتميز بحسابات تلقائية.
- متوسط تكلفة رأس المال المرجح (WACC): قسم مخصص لحساب WACC باستخدام مدخلات قابلة للتخصيص.
- النسب المالية الرئيسية: تقييم ربحية Jiangxi Fushine Pharmaceutical ، والكفاءة ، والرافعة المالية.
- مدخلات قابلة للتخصيص: بسهولة تعديل نمو الإيرادات ، هوامش الربح ، ومعدلات الضرائب.
- لوحة القيادة الصافية: التمثيلات المرئية ، بما في ذلك المخططات والجداول ، التي تلخص نتائج التقييم الأساسية.
Disclaimer
All information, articles, and product details provided on this website are for general informational and educational purposes only. We do not claim any ownership over, nor do we intend to infringe upon, any trademarks, copyrights, logos, brand names, or other intellectual property mentioned or depicted on this site. Such intellectual property remains the property of its respective owners, and any references here are made solely for identification or informational purposes, without implying any affiliation, endorsement, or partnership.
We make no representations or warranties, express or implied, regarding the accuracy, completeness, or suitability of any content or products presented. Nothing on this website should be construed as legal, tax, investment, financial, medical, or other professional advice. In addition, no part of this site—including articles or product references—constitutes a solicitation, recommendation, endorsement, advertisement, or offer to buy or sell any securities, franchises, or other financial instruments, particularly in jurisdictions where such activity would be unlawful.
All content is of a general nature and may not address the specific circumstances of any individual or entity. It is not a substitute for professional advice or services. Any actions you take based on the information provided here are strictly at your own risk. You accept full responsibility for any decisions or outcomes arising from your use of this website and agree to release us from any liability in connection with your use of, or reliance upon, the content or products found herein.