
|
Simplex Holdings ، Inc. (4373.t) تقييم DCF |
Fully Editable: Tailor To Your Needs In Excel Or Sheets
Professional Design: Trusted, Industry-Standard Templates
Investor-Approved Valuation Models
MAC/PC Compatible, Fully Unlocked
No Expertise Is Needed; Easy To Follow
Simplex Holdings, Inc. (4373.T) Bundle
اكتشف الإمكانات المالية لـ Simplex Holdings ، Inc. (4373T) مع حاسبة DCF سهلة الاستخدام! أدخل افتراضاتك المتعلقة بالنمو والهوامش والتكاليف لحساب القيمة الجوهرية لـ Simplex Holdings ، Inc. (4373T) وصقل نهج الاستثمار الخاص بك.
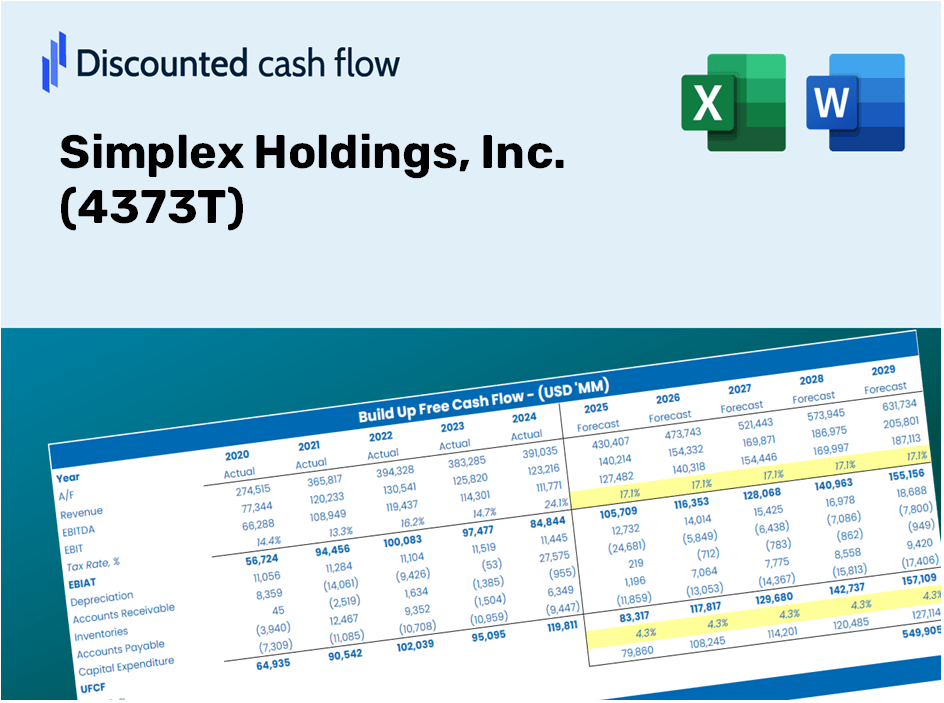
Discounted Cash Flow (DCF) - (USD MM)
| Year | AY1 2020 |
AY2 2021 |
AY3 2022 |
AY4 2023 |
AY5 2024 |
FY1 2025 |
FY2 2026 |
FY3 2027 |
FY4 2028 |
FY5 2029 |
|---|---|---|---|---|---|---|---|---|---|---|
| Revenue | 27,532.0 | 30,579.0 | 34,946.0 | 40,708.0 | 47,394.0 | 54,297.0 | 62,205.5 | 71,265.8 | 81,645.8 | 93,537.7 |
| Revenue Growth, % | 0 | 11.07 | 14.28 | 16.49 | 16.42 | 14.57 | 14.57 | 14.57 | 14.57 | 14.57 |
| EBITDA | 6,830.0 | 8,550.0 | 9,992.0 | 11,458.0 | 13,585.0 | 15,004.6 | 17,190.0 | 19,693.8 | 22,562.2 | 25,848.5 |
| EBITDA, % | 24.81 | 27.96 | 28.59 | 28.15 | 28.66 | 27.63 | 27.63 | 27.63 | 27.63 | 27.63 |
| Depreciation | 2,321.0 | 2,188.0 | 2,529.0 | 2,555.0 | 2,756.0 | 3,791.4 | 4,343.7 | 4,976.3 | 5,701.1 | 6,531.5 |
| Depreciation, % | 8.43 | 7.16 | 7.24 | 6.28 | 5.82 | 6.98 | 6.98 | 6.98 | 6.98 | 6.98 |
| EBIT | 4,509.0 | 6,362.0 | 7,463.0 | 8,903.0 | 10,829.0 | 11,213.2 | 12,846.4 | 14,717.5 | 16,861.1 | 19,316.9 |
| EBIT, % | 16.38 | 20.81 | 21.36 | 21.87 | 22.85 | 20.65 | 20.65 | 20.65 | 20.65 | 20.65 |
| Total Cash | 8,068.0 | 13,966.0 | 12,832.0 | 13,731.0 | 13,438.0 | 18,871.4 | 21,620.1 | 24,769.1 | 28,376.8 | 32,509.9 |
| Total Cash, percent | .0 | .0 | .0 | .0 | .0 | .0 | .0 | .0 | .0 | .0 |
| Account Receivables | 6,302.0 | 5,743.0 | 8,820.0 | 10,093.0 | 13,021.0 | 12,941.9 | 14,826.9 | 16,986.5 | 19,460.6 | 22,295.1 |
| Account Receivables, % | 22.89 | 18.78 | 25.24 | 24.79 | 27.47 | 23.84 | 23.84 | 23.84 | 23.84 | 23.84 |
| Inventories | 7.0 | 8.0 | 17.0 | 1.0 | .0 | 11.2 | 12.8 | 14.6 | 16.8 | 19.2 |
| Inventories, % | 0.02542496 | 0.02616174 | 0.04864648 | 0.00245652 | 0 | 0.02053794 | 0.02053794 | 0.02053794 | 0.02053794 | 0.02053794 |
| Accounts Payable | 1,708.0 | 2,278.0 | 888.0 | 2,837.0 | 2,826.0 | 3,162.9 | 3,623.6 | 4,151.4 | 4,756.1 | 5,448.8 |
| Accounts Payable, % | 6.2 | 7.45 | 2.54 | 6.97 | 5.96 | 5.83 | 5.83 | 5.83 | 5.83 | 5.83 |
| Capital Expenditure | -234.0 | -141.0 | -478.0 | -988.0 | -982.0 | -779.5 | -893.0 | -1,023.1 | -1,172.1 | -1,342.8 |
| Capital Expenditure, % | -0.84992 | -0.4611 | -1.37 | -2.43 | -2.07 | -1.44 | -1.44 | -1.44 | -1.44 | -1.44 |
| Tax Rate, % | 26.82 | 26.82 | 26.82 | 26.82 | 26.82 | 26.82 | 26.82 | 26.82 | 26.82 | 26.82 |
| EBITAT | 3,111.7 | 4,321.1 | 5,554.8 | 6,305.9 | 7,925.2 | 7,969.8 | 9,130.6 | 10,460.5 | 11,984.1 | 13,729.6 |
| Depreciation | ||||||||||
| Changes in Account Receivables | ||||||||||
| Changes in Inventories | ||||||||||
| Changes in Accounts Payable | ||||||||||
| Capital Expenditure | ||||||||||
| UFCF | 597.7 | 7,496.1 | 3,129.8 | 8,564.9 | 6,761.2 | 11,386.6 | 11,155.3 | 12,780.1 | 14,641.5 | 16,774.1 |
| WACC, % | 8.45 | 8.44 | 8.46 | 8.45 | 8.46 | 8.45 | 8.45 | 8.45 | 8.45 | 8.45 |
| PV UFCF | ||||||||||
| SUM PV UFCF | 51,768.0 | |||||||||
| Long Term Growth Rate, % | 3.00 | |||||||||
| Free cash flow (T + 1) | 17,277 | |||||||||
| Terminal Value | 316,963 | |||||||||
| Present Terminal Value | 211,272 | |||||||||
| Enterprise Value | 263,040 | |||||||||
| Net Debt | 5,187 | |||||||||
| Equity Value | 257,853 | |||||||||
| Diluted Shares Outstanding, MM | 60 | |||||||||
| Equity Value Per Share | 4,316.19 |
ماذا ستتلقى
- Authentic Simplex Holdings (4373T) البيانات المالية: مسبقة السكان مع البيانات التاريخية والمتوقعة للتحليل الشامل.
- قالب قابل للتخصيص تمامًا: بسهولة ضبط المقاييس الرئيسية مثل نمو الإيرادات ، WACC ، و EBITDA النسبة المئوية.
- الحسابات الفورية: شاهد كقيمة جوهرية لتحديثات Simplex Holdings (4373T) تلقائيًا بناءً على تعديلاتك.
- أداة التقييم المهنية: مصمم للمستثمرين والمحللين والمستشارين الذين يهدفون إلى نتائج DCF دقيقة.
- تصميم بديهي: تخطيط سهل الاستخدام مع تعليمات واضحة مناسبة لجميع مستويات المهارة.
الميزات الرئيسية
- البيانات التي تم تحميلها مسبقًا: البيانات المالية التاريخية والتوقعات المليئة مسبقًا لـ Simplex Holdings ، Inc. (4373T).
- مدخلات قابلة للتعديل بالكامل: تعديل WACC ، ومعدلات الضرائب ، ونمو الإيرادات ، وهامش EBITDA حسب الحاجة.
- النتائج الفورية: Watch Simplex Holdings ، Inc. (4373T) تحديث القيمة الجوهرية في الوقت الفعلي.
- واضحة المخرجات المرئية: مخططات لوحة القيادة التفاعلية تعرض نتائج التقييم والمقاييس الأساسية.
- بنيت للدقة: أداة موثوقة مصممة للمحللين والمستثمرين والمهنيين الماليين.
كيف تعمل
- تحميل: الحصول على ملف Excel جاهز للاستخدام يحتوي على بيانات مالية Simplex Holdings ، Inc. (4373T).
- تخصيص: تخصيص توقعاتك ، بما في ذلك نمو الإيرادات ، EBITDA ٪ ، و WACC.
- تحديثات الوقت الحقيقي: يتم تحديث القيمة الجوهرية وحسابات NPV تلقائيًا عند إجراء تغييرات.
- اختبار السيناريو: توليد توقعات مختلفة ومقارنة النتائج على الفور.
- قرارات مستنيرة: الاستفادة من نتائج التقييم لتشكيل استراتيجية الاستثمار الخاصة بك.
لماذا تختار حاسبة Simplex Holdings ، Inc.؟
- بيانات موثوقة: توفر Authentic Simplex Holdings ، Inc. نتائج تقييم جديرة بالثقة.
- خيارات مرنة: تعديل العوامل الأساسية مثل معدلات النمو و WACC ومعدلات الضرائب لتتماشى مع توقعاتك.
- فعال: توفر لك الحسابات المدمجة متاعب البدء من الألف إلى الياء.
- الجودة المهنية: مصممة للمستثمرين والمحللين والمستشارين على حد سواء.
- تصميم سهل الاستخدام: واجهة سهلة التنقيب وإرشادات مسح تلبي جميع المستخدمين.
من يمكنه الاستفادة من Simplex Holdings ، Inc. (4373T)؟
- المستثمرون: تقييم القيمة العادلة لـ Simplex Holdings ، Inc. (4373T) بدقة قبل اتخاذ خيارات الاستثمار.
- المدير المالي: الاستفادة من نموذج DCF عالي الجودة لتقارير وتحليل مالي شامل.
- الاستشاريون: تخصيص القالب بفعالية لتقارير تقييم العميل.
- رواد الأعمال: اكتشف تقنيات النمذجة المالية التي تستخدمها شركة Fortune 500 الرائدة.
- المعلمون: توظيفه كمورد لتدريس أساليب التقييم بفعالية.
محتويات القالب
- نموذج DCF المليء مسبقًا: Simplex Holdings ، Inc. (4373T) البيانات المالية جاهزة للاستخدام الفوري.
- حاسبة WACC: حسابات شاملة لمتوسط تكلفة رأس المال المرجح.
- النسب المالية: تقييم Simplex Holdings ، Inc. (4373T) الربحية والرافعة المالية والكفاءة التشغيلية.
- مدخلات قابلة للتحرير: تعديل الافتراضات بما في ذلك معدلات النمو والهوامش و Capex لتكييف تحليلك.
- البيانات المالية: الوصول إلى التقارير السنوية والفصلية للتقييم المتعمق.
- لوحة القيادة التفاعلية: تصور دون عناء مقاييس التقييم الرئيسية والنتائج.
Disclaimer
All information, articles, and product details provided on this website are for general informational and educational purposes only. We do not claim any ownership over, nor do we intend to infringe upon, any trademarks, copyrights, logos, brand names, or other intellectual property mentioned or depicted on this site. Such intellectual property remains the property of its respective owners, and any references here are made solely for identification or informational purposes, without implying any affiliation, endorsement, or partnership.
We make no representations or warranties, express or implied, regarding the accuracy, completeness, or suitability of any content or products presented. Nothing on this website should be construed as legal, tax, investment, financial, medical, or other professional advice. In addition, no part of this site—including articles or product references—constitutes a solicitation, recommendation, endorsement, advertisement, or offer to buy or sell any securities, franchises, or other financial instruments, particularly in jurisdictions where such activity would be unlawful.
All content is of a general nature and may not address the specific circumstances of any individual or entity. It is not a substitute for professional advice or services. Any actions you take based on the information provided here are strictly at your own risk. You accept full responsibility for any decisions or outcomes arising from your use of this website and agree to release us from any liability in connection with your use of, or reliance upon, the content or products found herein.