
|
Sumitomo Electric Industries ، Ltd. (5802.T) تقييم DCF |
Fully Editable: Tailor To Your Needs In Excel Or Sheets
Professional Design: Trusted, Industry-Standard Templates
Investor-Approved Valuation Models
MAC/PC Compatible, Fully Unlocked
No Expertise Is Needed; Easy To Follow
Sumitomo Electric Industries, Ltd. (5802.T) Bundle
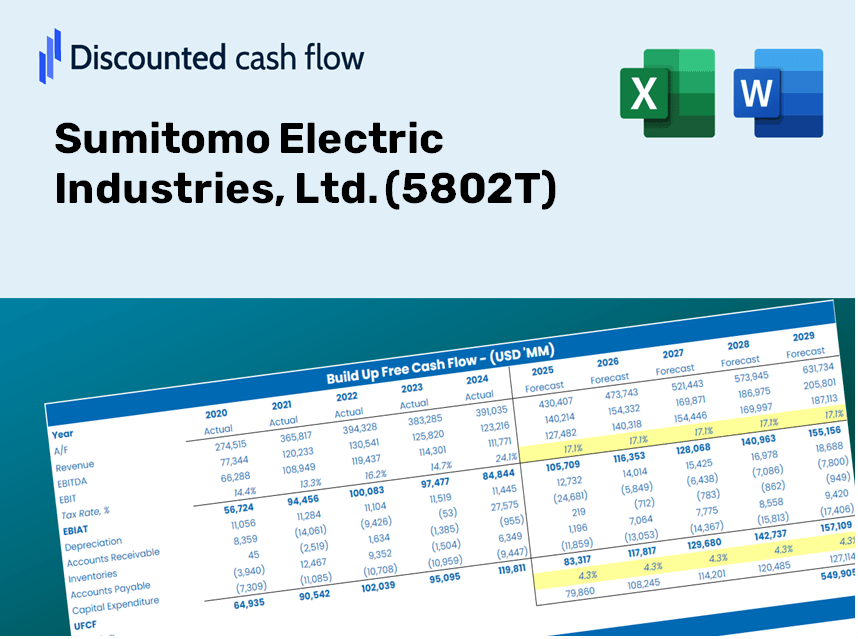
تقييم Sumitomo Electric Industries ، Ltd. (5802T) التوقعات المالية مثل خبير! توفر حاسبة DCF (5802T) بيانات مالية مملوءة مسبقًا وتتيح لك المرونة الكاملة لتعديل نمو الإيرادات ، WACC ، الهوامش ، وغيرها من الافتراضات الحاسمة بناءً على توقعاتك.
Discounted Cash Flow (DCF) - (USD MM)
| Year | AY1 2021 |
AY2 2022 |
AY3 2023 |
AY4 2024 |
AY5 2025 |
FY1 2026 |
FY2 2027 |
FY3 2028 |
FY4 2029 |
FY5 2030 |
|---|---|---|---|---|---|---|---|---|---|---|
| Revenue | 2,918,580.0 | 3,367,863.0 | 4,005,561.0 | 4,402,814.0 | 4,679,789.0 | 5,271,046.3 | 5,937,004.6 | 6,687,101.8 | 7,531,968.5 | 8,483,577.8 |
| Revenue Growth, % | 0 | 15.39 | 18.93 | 9.92 | 6.29 | 12.63 | 12.63 | 12.63 | 12.63 | 12.63 |
| EBITDA | 284,932.0 | 346,831.0 | 408,645.0 | 474,199.0 | 540,652.0 | 554,368.2 | 624,408.6 | 703,298.0 | 792,154.6 | 892,237.6 |
| EBITDA, % | 9.76 | 10.3 | 10.2 | 10.77 | 11.55 | 10.52 | 10.52 | 10.52 | 10.52 | 10.52 |
| Depreciation | 169,188.0 | 181,351.0 | 196,066.0 | 206,333.0 | 206,839.0 | 265,478.9 | 299,020.2 | 336,799.2 | 379,351.3 | 427,279.6 |
| Depreciation, % | 5.8 | 5.38 | 4.89 | 4.69 | 4.42 | 5.04 | 5.04 | 5.04 | 5.04 | 5.04 |
| EBIT | 115,744.0 | 165,480.0 | 212,579.0 | 267,866.0 | 333,813.0 | 288,889.3 | 325,388.4 | 366,498.8 | 412,803.3 | 464,958.0 |
| EBIT, % | 3.97 | 4.91 | 5.31 | 6.08 | 7.13 | 5.48 | 5.48 | 5.48 | 5.48 | 5.48 |
| Total Cash | 254,395.0 | 259,581.0 | 283,425.0 | 269,744.0 | 295,903.0 | 378,981.9 | 426,863.5 | 480,794.6 | 541,539.5 | 609,959.0 |
| Total Cash, percent | .0 | .0 | .0 | .0 | .0 | .0 | .0 | .0 | .0 | .0 |
| Account Receivables | 753,292.0 | 812,358.0 | 873,237.0 | 901,040.0 | 900,634.0 | 1,174,831.8 | 1,323,263.2 | 1,490,447.9 | 1,678,755.1 | 1,890,853.6 |
| Account Receivables, % | 25.81 | 24.12 | 21.8 | 20.47 | 19.25 | 22.29 | 22.29 | 22.29 | 22.29 | 22.29 |
| Inventories | 606,343.0 | 844,837.0 | 851,224.0 | 885,017.0 | 922,998.0 | 1,127,327.3 | 1,269,756.9 | 1,430,181.4 | 1,610,874.5 | 1,814,396.7 |
| Inventories, % | 20.78 | 25.09 | 21.25 | 20.1 | 19.72 | 21.39 | 21.39 | 21.39 | 21.39 | 21.39 |
| Accounts Payable | 397,439.0 | 444,985.0 | 445,951.0 | 479,831.0 | 473,834.0 | 621,845.6 | 700,411.2 | 788,903.1 | 888,575.2 | 1,000,840.2 |
| Accounts Payable, % | 13.62 | 13.21 | 11.13 | 10.9 | 10.13 | 11.8 | 11.8 | 11.8 | 11.8 | 11.8 |
| Capital Expenditure | -166,831.0 | -174,059.0 | -184,467.0 | -179,323.0 | -199,824.0 | -251,244.7 | -282,987.7 | -318,741.1 | -359,011.7 | -404,370.2 |
| Capital Expenditure, % | -5.72 | -5.17 | -4.61 | -4.07 | -4.27 | -4.77 | -4.77 | -4.77 | -4.77 | -4.77 |
| Tax Rate, % | 36.27 | 36.27 | 36.27 | 36.27 | 36.27 | 36.27 | 36.27 | 36.27 | 36.27 | 36.27 |
| EBITAT | 59,103.5 | 99,653.7 | 121,889.5 | 168,126.4 | 212,729.2 | 170,511.5 | 192,054.3 | 216,319.0 | 243,649.3 | 274,432.7 |
| Depreciation | ||||||||||
| Changes in Account Receivables | ||||||||||
| Changes in Inventories | ||||||||||
| Changes in Accounts Payable | ||||||||||
| Capital Expenditure | ||||||||||
| UFCF | -900,735.5 | -143,068.3 | 67,188.5 | 167,420.4 | 176,172.2 | -145,769.9 | -4,208.5 | -4,740.2 | -5,339.1 | -6,013.7 |
| WACC, % | 4.92 | 4.99 | 4.97 | 5.01 | 5.01 | 4.98 | 4.98 | 4.98 | 4.98 | 4.98 |
| PV UFCF | ||||||||||
| SUM PV UFCF | -155,882.6 | |||||||||
| Long Term Growth Rate, % | 3.00 | |||||||||
| Free cash flow (T + 1) | -6,194 | |||||||||
| Terminal Value | -312,802 | |||||||||
| Present Terminal Value | -245,320 | |||||||||
| Enterprise Value | -401,202 | |||||||||
| Net Debt | 481,383 | |||||||||
| Equity Value | -882,585 | |||||||||
| Diluted Shares Outstanding, MM | 780 | |||||||||
| Equity Value Per Share | -1,131.72 |
ماذا ستتلقى
- مدخلات التنبؤ المرنة: تعديل الافتراضات بسهولة (النمو ٪ ، الهوامش ، WACC) لاستكشاف السيناريوهات المختلفة.
- البيانات المُثبّعة مسبقًا: البيانات المالية لـ Sumitomo Electric Industries مدمجة بالفعل لتسريع تحليلك.
- حسابات DCF الفورية: يحسب القالب تلقائيًا القيمة الحالية الصافية (NPV) والقيمة الجوهرية لك.
- احترافي وقابل للتخصيص: نموذج Excel المكرر مصمم لتلبية متطلبات التقييم الخاصة بك.
- مصمم للمحللين والمستثمرين: مثالي لتقييم التوقعات ، وتأكيد الاستراتيجيات ، وتحسين الكفاءة.
الميزات الرئيسية
- مدخلات التنبؤ القابلة للتخصيص: اضبط المقاييس الأساسية مثل نمو الإيرادات ، ونسبة الأرباح قبل الفوائد والضرائب والإهلاك والاستهلاك ، والنفقات الرأسمالية.
- تقييم DCF الفوري: يحسب بسرعة القيمة الجوهرية ، والقيمة الحالية الصافية (NPV) ، والمخرجات الإضافية.
- دقة عالية الدقة: يستخدم البيانات المالية الفعلية لـ Sumitomo Electric لنتائج التقييم التي يمكن الاعتماد عليها.
- تحليل السيناريو السهل: تقييم الافتراضات المختلفة ومقارنة النتائج دون متاعب.
- داعم الكفاءة: القضاء على تعقيد إنشاء نماذج تقييم معقدة من الألف إلى الياء.
كيف تعمل
- تحميل: احصل على ملف Excel الذي تم بناؤه مسبقًا مع البيانات المالية لـ Sumitomo Electric Industries ، Ltd. (5802T).
- تخصيص: تعديل التوقعات الرئيسية ، بما في ذلك نمو الإيرادات ، EBITDA ٪ ، و WACC.
- التحديث تلقائيًا: حسابات القيمة الجوهرية وتحديث NPV في الوقت الفعلي.
- سيناريوهات الاختبار: توليد توقعات متعددة ومقارنة النتائج على الفور.
- اتخاذ القرارات: الاستفادة من نتائج التقييم لتشكيل استراتيجية الاستثمار الخاصة بك.
لماذا تختار هذه الآلة الحاسبة من Sumitomo Electric Industries ، Ltd. (5802T)؟
- توفير الوقت: لا حاجة لإنشاء نموذج DCF بنفسك - إنه مستعد تمامًا لاستخدامك.
- الدقة المعززة: البيانات المالية التي يمكن الاعتماد عليها تقلل من أخطاء التقييم.
- قابلة للتخصيص تماما: اضبط النموذج للتوافق مع افتراضاتك والتوقعات المحددة.
- سهل الاستخدام: المخططات والمخرجات البديهية تبسيط تحليل النتائج.
- أيد من قبل المهنيين: تم تصميمه للخبراء الذين يعطون الأولوية للدقة وسهولة الاستخدام.
من يجب أن يستخدم هذا المنتج؟
- المستثمرون الأفراد: كسب رؤى لاتخاذ قرارات مستنيرة حول شراء أو بيع Sumitomo Electric Industries ، Ltd. (5802T).
- المحللون الماليون: تعزيز عمليات التقييم مع نماذج مالية جاهزة مصممة خصيصًا لـ Sumitomo Electric Industries ، Ltd. (5802T).
- الاستشاريون: تزويد العملاء برؤى تقييم دقيقة لـ Sumitomo Electric Industries ، Ltd. (5802T) في الوقت المناسب.
- أصحاب الأعمال: تعرف على كيفية تقدير الشركات الكبرى مثل Sumitomo Electric Industries ، Ltd. (5802T) لإبلاغ استراتيجية عملك.
- طلاب التمويل: استكشاف تقنيات التقييم باستخدام بيانات العالم الحقيقي ودراسات الحالة المتعلقة بـ Sumitomo Electric Industries ، Ltd. (5802T).
محتويات القالب
- نموذج DCF المليء مسبقًا: Sumitomo Electric Industries ، Ltd. (5802T) البيانات المالية جاهزة للتطبيق الفوري.
- حاسبة WACC: حسابات شاملة لمتوسط تكلفة رأس المال المرجح.
- النسب المالية: تقييم ربحية Sumitomo Electric والرافعة المالية والكفاءة التشغيلية.
- مدخلات قابلة للتحرير: تعديل المعلمات مثل معدلات النمو والهوامش و Capex لتكييف السيناريوهات الخاصة بك.
- البيانات المالية: الوصول إلى التقارير السنوية والفصلية للتحليل المتعمق.
- لوحة القيادة التفاعلية: تصور بسلاسة مقاييس التقييم الأساسية والنتائج.
Disclaimer
All information, articles, and product details provided on this website are for general informational and educational purposes only. We do not claim any ownership over, nor do we intend to infringe upon, any trademarks, copyrights, logos, brand names, or other intellectual property mentioned or depicted on this site. Such intellectual property remains the property of its respective owners, and any references here are made solely for identification or informational purposes, without implying any affiliation, endorsement, or partnership.
We make no representations or warranties, express or implied, regarding the accuracy, completeness, or suitability of any content or products presented. Nothing on this website should be construed as legal, tax, investment, financial, medical, or other professional advice. In addition, no part of this site—including articles or product references—constitutes a solicitation, recommendation, endorsement, advertisement, or offer to buy or sell any securities, franchises, or other financial instruments, particularly in jurisdictions where such activity would be unlawful.
All content is of a general nature and may not address the specific circumstances of any individual or entity. It is not a substitute for professional advice or services. Any actions you take based on the information provided here are strictly at your own risk. You accept full responsibility for any decisions or outcomes arising from your use of this website and agree to release us from any liability in connection with your use of, or reliance upon, the content or products found herein.