
|
شركة Sinolink Securities Co. ، Ltd. (600109.SS) تقييم DCF |
Fully Editable: Tailor To Your Needs In Excel Or Sheets
Professional Design: Trusted, Industry-Standard Templates
Investor-Approved Valuation Models
MAC/PC Compatible, Fully Unlocked
No Expertise Is Needed; Easy To Follow
Sinolink Securities Co., Ltd. (600109.SS) Bundle
تبسيط تحليلك وتحسين الدقة مع حاسبة (600109SS) DCF! باستخدام بيانات حقيقية من Sinolink Securities Co. ، Ltd. وافتراضات قابلة للتخصيص ، تمكنك هذه الأداة من التنبؤ وتحليل وقيمة (600109SS) مثل المستثمر المحترف.
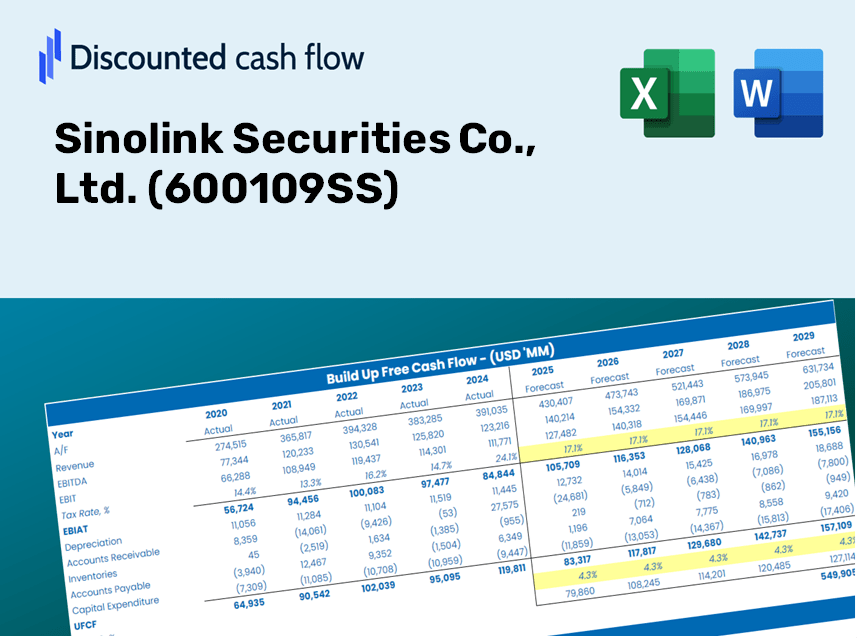
Discounted Cash Flow (DCF) - (USD MM)
| Year | AY1 2020 |
AY2 2021 |
AY3 2022 |
AY4 2023 |
AY5 2024 |
FY1 2025 |
FY2 2026 |
FY3 2027 |
FY4 2028 |
FY5 2029 |
|---|---|---|---|---|---|---|---|---|---|---|
| Revenue | 7,251.0 | 8,822.8 | 5,638.3 | 8,736.9 | 6,558.4 | 6,814.3 | 7,080.1 | 7,356.3 | 7,643.3 | 7,941.5 |
| Revenue Growth, % | 0 | 21.68 | -36.09 | 54.96 | -24.93 | 3.9 | 3.9 | 3.9 | 3.9 | 3.9 |
| EBITDA | 3,079.0 | 3,136.3 | 2,400.3 | .0 | 2,288.6 | 2,119.0 | 2,201.6 | 2,287.5 | 2,376.8 | 2,469.5 |
| EBITDA, % | 42.46 | 35.55 | 42.57 | 0 | 34.9 | 31.1 | 31.1 | 31.1 | 31.1 | 31.1 |
| Depreciation | 86.0 | 176.0 | 232.6 | 256.0 | 265.7 | 194.7 | 202.3 | 210.2 | 218.4 | 226.9 |
| Depreciation, % | 1.19 | 1.99 | 4.13 | 2.93 | 4.05 | 2.86 | 2.86 | 2.86 | 2.86 | 2.86 |
| EBIT | 2,993.1 | 2,960.4 | 2,167.7 | -256.0 | 2,022.9 | 1,924.3 | 1,999.3 | 2,077.3 | 2,158.4 | 2,242.6 |
| EBIT, % | 41.28 | 33.55 | 38.45 | -2.93 | 30.84 | 28.24 | 28.24 | 28.24 | 28.24 | 28.24 |
| Total Cash | 35,374.1 | 4,056.4 | 5,310.2 | 56,935.2 | 4,550.2 | 5,581.4 | 5,799.1 | 6,025.4 | 6,260.5 | 6,504.7 |
| Total Cash, percent | .0 | .0 | .0 | .0 | .0 | .0 | .0 | .0 | .0 | .0 |
| Account Receivables | 15,025.5 | 21,180.2 | 269.9 | 28,283.7 | 398.2 | 4,236.6 | 4,401.8 | 4,573.6 | 4,752.0 | 4,937.4 |
| Account Receivables, % | 207.22 | 240.06 | 4.79 | 323.73 | 6.07 | 62.17 | 62.17 | 62.17 | 62.17 | 62.17 |
| Inventories | .0 | 25,066.5 | 24,861.4 | .0 | .0 | 2,725.7 | 2,832.0 | 2,942.5 | 3,057.3 | 3,176.6 |
| Inventories, % | 0 | 284.11 | 440.94 | 0 | 0 | 40 | 40 | 40 | 40 | 40 |
| Accounts Payable | 629.8 | 635.6 | 1,304.7 | 1,496.6 | 2,197.7 | 1,222.1 | 1,269.8 | 1,319.3 | 1,370.8 | 1,424.2 |
| Accounts Payable, % | 8.69 | 7.2 | 23.14 | 17.13 | 33.51 | 17.93 | 17.93 | 17.93 | 17.93 | 17.93 |
| Capital Expenditure | -111.4 | -124.2 | -160.9 | -187.1 | -153.2 | -140.0 | -145.5 | -151.2 | -157.1 | -163.2 |
| Capital Expenditure, % | -1.54 | -1.41 | -2.85 | -2.14 | -2.34 | -2.06 | -2.06 | -2.06 | -2.06 | -2.06 |
| Tax Rate, % | 17.43 | 17.43 | 17.43 | 17.43 | 17.43 | 17.43 | 17.43 | 17.43 | 17.43 | 17.43 |
| EBITAT | 2,299.5 | 2,308.1 | 1,882.3 | -206.5 | 1,670.3 | 1,558.2 | 1,619.0 | 1,682.2 | 1,747.8 | 1,816.0 |
| Depreciation | ||||||||||
| Changes in Account Receivables | ||||||||||
| Changes in Inventories | ||||||||||
| Changes in Accounts Payable | ||||||||||
| Capital Expenditure | ||||||||||
| UFCF | -12,121.5 | -28,855.5 | 23,738.5 | -3,098.2 | 30,369.2 | -5,926.8 | 1,451.9 | 1,508.5 | 1,567.4 | 1,628.5 |
| WACC, % | 7.31 | 7.34 | 7.54 | 7.4 | 7.44 | 7.41 | 7.41 | 7.41 | 7.41 | 7.41 |
| PV UFCF | ||||||||||
| SUM PV UFCF | -725.1 | |||||||||
| Long Term Growth Rate, % | 2.00 | |||||||||
| Free cash flow (T + 1) | 1,661 | |||||||||
| Terminal Value | 30,723 | |||||||||
| Present Terminal Value | 21,493 | |||||||||
| Enterprise Value | 20,768 | |||||||||
| Net Debt | 37,479 | |||||||||
| Equity Value | -16,710 | |||||||||
| Diluted Shares Outstanding, MM | 3,695 | |||||||||
| Equity Value Per Share | -4.52 |
ماذا ستتلقى
- بيانات مالية شاملة (600109SS): الوصول إلى الشخصيات التاريخية والمتوقعة للتقييم الدقيق.
- المعلمات القابلة للتخصيص: اضبط WACC ، ومعدلات الضرائب ، ونمو الإيرادات ، وافتراضات استثمار رأس المال.
- الحسابات في الوقت الحقيقي: الحساب الديناميكي للقيمة الجوهرية و NPV.
- استكشاف السيناريو: تحليل السيناريوهات المختلفة لتقييم الأداء المستقبلي لـ Sinolink Securities.
- واجهة سهلة الاستخدام: مصمم لكل من المحترفين في الصناعة والوافدين الجدد.
الميزات الرئيسية
- بيانات SINOLINK دقيقة دقيقة: الوصول إلى البيانات التاريخية الموثوقة مسبقًا والتنبؤات المستقبلية.
- معلمات التنبؤ المرنة: تعديل الحقول ذات الضوء الأصفر مثل WACC ومعدلات النمو وهامش الربح.
- الحسابات في الوقت الحقيقي: استمتع بالتحديثات التلقائية لـ DCF ، صافي القيمة الحالية (NPV) ، وتحليلات التدفق النقدي.
- لوحة معلومات سهلة الاستخدام: مخططات وملخصات واضحة وموجزة للمساعدة في تصور نتائج التقييم الخاصة بك.
- مصمم لجميع المستويات: تصميم مباشر وبديهي مناسب للمستثمرين والمديرين الماليين والمستشارين على حد سواء.
كيف تعمل
- الخطوة 1: قم بتنزيل قالب Excel Prebuilt يحتوي على بيانات Sinolink Securities Co. ، Ltd. (600109SS).
- الخطوة 2: انتقل عبر الأوراق المملوءة مسبقًا للتعرف على المقاييس الأساسية.
- الخطوة 3: تعديل التنبؤات والافتراضات في الخلايا الصفراء القابلة للتحرير (WACC ، النمو ، الهوامش).
- الخطوة 4: انظر على الفور النتائج المعاد حسابها ، بما في ذلك القيمة الجوهرية لشركة Sinolink Securities Co. ، Ltd. (600109SS).
- الخطوة 5: استخدم المخرجات لاتخاذ قرارات استثمار مستنيرة أو إنشاء تقارير شاملة.
لماذا تختار حاسبة Sinolink Securities؟
- واجهة سهلة الاستخدام: مثالي لكل من المستخدمين المبتدئين وذوي الخبرة.
- مدخلات قابلة للتخصيص: قم بضبط المعلمات بسهولة لتناسب تحليلاتك.
- تحديثات الوقت الحقيقي: عرض التغييرات الفورية في تقييم Sinolink أثناء تعديل المدخلات.
- البيانات المحملة مسبقًا: يأتي مع الأرقام المالية الفعلية لـ Sinolink للتقييمات السريعة.
- أيد من قبل الخبراء: يستخدمه المستثمرون والمحللون على نطاق واسع لاتخاذ القرارات الثاقبة.
من يمكنه الاستفادة من شركة Sinolink Securities Co. ، Ltd. (600109SS)؟
- المستثمرون الأفراد: اكتساب رؤى لاتخاذ قرارات مستنيرة بشأن تداول أسهم Sinolink Securities.
- المحللون الماليون: عزز مهام سير العمل الخاصة بك مع نماذج مالية شاملة خاصة بـ (600109SS).
- الاستشاريون: توفير تحليلات دقيقة وفي الوقت المناسب لعملائك فيما يتعلق بالأوراق المالية Sinolink.
- أصحاب الأعمال: تعرف على كيفية تقدير شركات مثل Sinolink Securities لإبلاغ استراتيجيات عملك.
- طلاب التمويل: الحصول على مهارات التقييم العملية باستخدام البيانات في الوقت الحقيقي وأمثلة من السوق.
محتويات القالب
- بيانات Sinolink Securities ذات التحميل المسبق: المقاييس المالية التاريخية والمتوقعة ، بما في ذلك الإيرادات ، والضاحية ، والنفقات الرأسمالية.
- نماذج DCF و WACC: جداول بيانات على مستوى الخبراء مصممة لحساب القيمة الجوهرية ومتوسط تكلفة رأس المال المرجح.
- مدخلات قابلة للتحرير: الخلايا ذات الضوء الصفراء لتعديل معدلات نمو الإيرادات ومعدلات الضرائب ومعدلات الخصم.
- البيانات المالية: تقارير مالية سنوية وفصلية مفصلة للتحليل المتعمق.
- النسب الرئيسية: نسب تقييم الربحية والرافعة المالية والكفاءة لتقييم الأداء.
- لوحة القيادة والمخططات: عروض البيانات البصرية تلخص نتائج التقييم والافتراضات الأساسية.
Disclaimer
All information, articles, and product details provided on this website are for general informational and educational purposes only. We do not claim any ownership over, nor do we intend to infringe upon, any trademarks, copyrights, logos, brand names, or other intellectual property mentioned or depicted on this site. Such intellectual property remains the property of its respective owners, and any references here are made solely for identification or informational purposes, without implying any affiliation, endorsement, or partnership.
We make no representations or warranties, express or implied, regarding the accuracy, completeness, or suitability of any content or products presented. Nothing on this website should be construed as legal, tax, investment, financial, medical, or other professional advice. In addition, no part of this site—including articles or product references—constitutes a solicitation, recommendation, endorsement, advertisement, or offer to buy or sell any securities, franchises, or other financial instruments, particularly in jurisdictions where such activity would be unlawful.
All content is of a general nature and may not address the specific circumstances of any individual or entity. It is not a substitute for professional advice or services. Any actions you take based on the information provided here are strictly at your own risk. You accept full responsibility for any decisions or outcomes arising from your use of this website and agree to release us from any liability in connection with your use of, or reliance upon, the content or products found herein.