
|
YTO Express Group Co. ، Ltd. (600233.SS) تقييم DCF |
Fully Editable: Tailor To Your Needs In Excel Or Sheets
Professional Design: Trusted, Industry-Standard Templates
Investor-Approved Valuation Models
MAC/PC Compatible, Fully Unlocked
No Expertise Is Needed; Easy To Follow
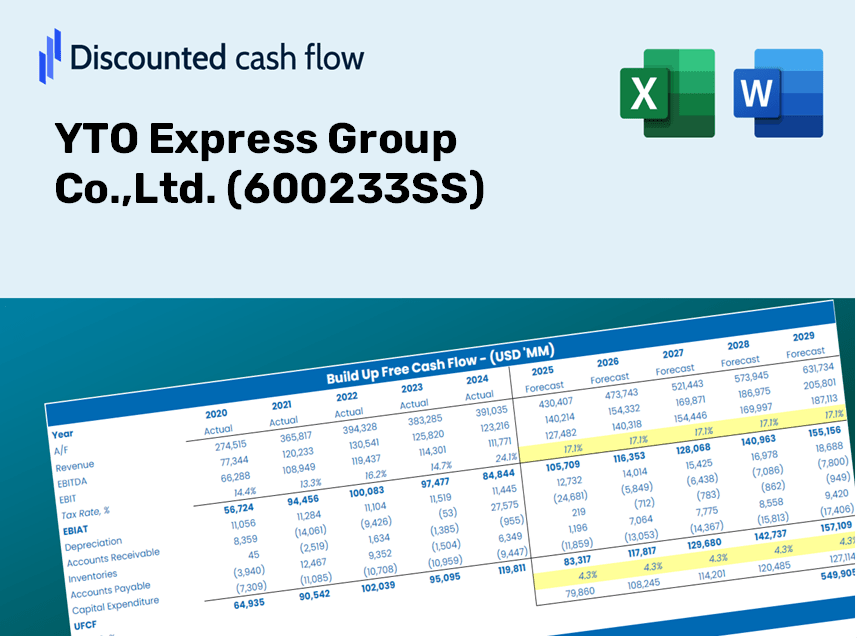
YTO Express Group Co.,Ltd. (600233.SS) Bundle
عزز استراتيجية الاستثمار الخاصة بك مع YTO Express Group Co. ، Ltd. (600233SS) حاسبة DCF! استكشاف البيانات المالية YTO الأصلية ، وضبط توقعات النمو والنفقات ، ولاحظ كيف تؤثر هذه التعديلات على القيمة الجوهرية لمجموعة YTO Express في الوقت الفعلي.
Discounted Cash Flow (DCF) - (USD MM)
| Year | AY1 2020 |
AY2 2021 |
AY3 2022 |
AY4 2023 |
AY5 2024 |
FY1 2025 |
FY2 2026 |
FY3 2027 |
FY4 2028 |
FY5 2029 |
|---|---|---|---|---|---|---|---|---|---|---|
| Revenue | 34,907.0 | 45,155.0 | 53,539.3 | 57,684.3 | 69,032.7 | 82,035.1 | 97,486.6 | 115,848.4 | 137,668.7 | 163,598.9 |
| Revenue Growth, % | 0 | 29.36 | 18.57 | 7.74 | 19.67 | 18.84 | 18.84 | 18.84 | 18.84 | 18.84 |
| EBITDA | 2,969.7 | 4,328.9 | 6,724.0 | 6,508.6 | 6,998.8 | 8,543.9 | 10,153.2 | 12,065.6 | 14,338.1 | 17,038.7 |
| EBITDA, % | 8.51 | 9.59 | 12.56 | 11.28 | 10.14 | 10.41 | 10.41 | 10.41 | 10.41 | 10.41 |
| Depreciation | 1,014.5 | 1,500.9 | 1,773.3 | 1,944.4 | 2,125.7 | 2,623.9 | 3,118.1 | 3,705.4 | 4,403.3 | 5,232.7 |
| Depreciation, % | 2.91 | 3.32 | 3.31 | 3.37 | 3.08 | 3.2 | 3.2 | 3.2 | 3.2 | 3.2 |
| EBIT | 1,955.2 | 2,828.0 | 4,950.7 | 4,564.1 | 4,873.1 | 5,920.1 | 7,035.1 | 8,360.2 | 9,934.8 | 11,806.1 |
| EBIT, % | 5.6 | 6.26 | 9.25 | 7.91 | 7.06 | 7.22 | 7.22 | 7.22 | 7.22 | 7.22 |
| Total Cash | 5,665.5 | 8,879.1 | 11,102.4 | 10,235.3 | 9,696.7 | 14,507.2 | 17,239.7 | 20,486.8 | 24,345.6 | 28,931.1 |
| Total Cash, percent | .0 | .0 | .0 | .0 | .0 | .0 | .0 | .0 | .0 | .0 |
| Account Receivables | 1,397.1 | 1,722.8 | 989.2 | 1,911.8 | 5,061.7 | 3,332.6 | 3,960.2 | 4,706.2 | 5,592.6 | 6,646.0 |
| Account Receivables, % | 4 | 3.82 | 1.85 | 3.31 | 7.33 | 4.06 | 4.06 | 4.06 | 4.06 | 4.06 |
| Inventories | 51.1 | 73.2 | 81.9 | 139.5 | 178.4 | 157.8 | 187.5 | 222.8 | 264.7 | 314.6 |
| Inventories, % | 0.14637 | 0.16206 | 0.15292 | 0.24177 | 0.2584 | 0.1923 | 0.1923 | 0.1923 | 0.1923 | 0.1923 |
| Accounts Payable | 4,296.5 | 4,365.4 | 4,218.0 | 5,612.5 | 6,083.9 | 7,940.5 | 9,436.1 | 11,213.4 | 13,325.5 | 15,835.4 |
| Accounts Payable, % | 12.31 | 9.67 | 7.88 | 9.73 | 8.81 | 9.68 | 9.68 | 9.68 | 9.68 | 9.68 |
| Capital Expenditure | -5,213.1 | -5,559.3 | -4,736.2 | -4,888.3 | -6,768.3 | -8,920.6 | -10,600.9 | -12,597.5 | -14,970.3 | -17,790.0 |
| Capital Expenditure, % | -14.93 | -12.31 | -8.85 | -8.47 | -9.8 | -10.87 | -10.87 | -10.87 | -10.87 | -10.87 |
| Tax Rate, % | 15.87 | 15.87 | 15.87 | 15.87 | 15.87 | 15.87 | 15.87 | 15.87 | 15.87 | 15.87 |
| EBITAT | 1,568.6 | 2,149.9 | 3,840.3 | 3,605.4 | 4,099.7 | 4,699.8 | 5,585.0 | 6,637.0 | 7,887.0 | 9,372.6 |
| Depreciation | ||||||||||
| Changes in Account Receivables | ||||||||||
| Changes in Inventories | ||||||||||
| Changes in Accounts Payable | ||||||||||
| Capital Expenditure | ||||||||||
| UFCF | 218.2 | -2,187.4 | 1,455.0 | 1,075.8 | -3,260.4 | 2,009.4 | -1,059.6 | -1,259.1 | -1,496.3 | -1,778.1 |
| WACC, % | 4.44 | 4.42 | 4.43 | 4.43 | 4.45 | 4.43 | 4.43 | 4.43 | 4.43 | 4.43 |
| PV UFCF | ||||||||||
| SUM PV UFCF | -2,842.0 | |||||||||
| Long Term Growth Rate, % | 3.00 | |||||||||
| Free cash flow (T + 1) | -1,831 | |||||||||
| Terminal Value | -127,647 | |||||||||
| Present Terminal Value | -102,751 | |||||||||
| Enterprise Value | -105,593 | |||||||||
| Net Debt | -2,380 | |||||||||
| Equity Value | -103,213 | |||||||||
| Diluted Shares Outstanding, MM | 3,444 | |||||||||
| Equity Value Per Share | -29.97 |
الفوائد التي ستتلقاها
- معلمات التنبؤ القابلة للتعديل: بسهولة تعديل الافتراضات الرئيسية (النمو ٪ ، الهوامش ، WACC) لنمذجة سيناريوهات مختلفة.
- بيانات السوق الشاملة: YTO Express Group Co. ، Ltd. (600233SS) البيانات المالية التي تم تحميلها مسبقًا لتعزيز تحليلك.
- نتائج DCF الآلية: يحسب القالب القيمة الحالية الصافية (NPV) والقيمة الجوهرية تلقائيًا.
- تصميم مصمم خصيصًا ومهنيًا: نموذج Excel المكرر الذي يمكن تخصيصه لتناسب متطلبات التقييم الخاصة بك.
- مصمم للمحللين والمستثمرين: مثالي لتقييم التوقعات ، والتحقق من الاستراتيجيات ، وتحسين الكفاءة.
الميزات الرئيسية
- 🔍 Real-Life YTO Express المالية: بيانات تاريخية ومتوقعة مملوءة مسبقًا لشركة YTO Express Group Co.، Ltd. (600233SS).
- ✏️ المدخلات القابلة للتخصيص بالكامل: قم بتعديل جميع المعلمات المهمة (الخلايا الصفراء) مثل WACC، والنمو٪، ومعدلات الضرائب.
- 📊 تقييم DCF المهني: تحسب الصيغ المدمجة القيمة الجوهرية لـ YTO Express باستخدام طريقة التدفق النقدي المخفض.
- ⚡ النتائج الفورية: تخيل تقييم YTO Express على الفور بعد إجراء التعديلات.
- تحليل السيناريو: اختبار ومقارنة النتائج لمختلف الافتراضات المالية جنبًا إلى جنب.
كيف تعمل
- الخطوة 1: قم بتنزيل ملف Excel.
- الخطوة 2: فحص البيانات المملوءة مسبقًا لشركة YTO Express Group Co. ، Ltd. (600233SS) بما في ذلك الأرقام التاريخية والمتوقعة.
- الخطوة 3: تعديل الافتراضات الرئيسية (المبرمة باللون الأصفر) بناءً على تحليلك.
- الخطوة 4: راقب عمليات إعادة الحساب التلقائية لقيمة YTO Express الداخلية.
- الخطوة 5: الاستفادة من نتائج استراتيجيات الاستثمار أو أغراض الإبلاغ.
لماذا تختار حاسبة YTO Express Group Co. ، Ltd. (600233SS)؟
- وفر الوقت: ابدأ العمل فورًا باستخدام نموذج DCF مسبقًا-لا يوجد إعداد مطلوب.
- تعزيز الدقة: المقاييس المالية والحسابات التي يمكن الاعتماد عليها تقلل من أخطاء التقييم.
- قابلة للتخصيص تماما: اضبط النموذج للتوافق مع افتراضاتك والتوقعات المحددة.
- سهل الاستخدام: المخططات والمخرجات البديهية تبسيط تفسير البيانات وتحليلها.
- يفضله المهنيون: صُمم للخبراء الذين يعطون الأولوية للدقة والوظائف.
من يمكنه الاستفادة من هذا المنتج؟
- المستثمرون: تقييم القيمة الحقيقية لشركة YTO Express Group Co. ، Ltd. (600233SS) قبل اتخاذ خيارات الاستثمار.
- المدير المالي: الاستفادة من نموذج DCF شامل للتقارير المالية الدقيقة والتحليل.
- الاستشاريون: تعديل القالب لتقارير تقييم العميل.
- رواد الأعمال: اكتساب رؤى حول ممارسات النمذجة المالية لشركات اللوجستيات الرائدة.
- المعلمون: توظيفها كمورد لتدريس تقنيات التقييم بفعالية.
ما يحتويه القالب
- البيانات التاريخية: يوفر YTO Express Group Co. ، Ltd. الأداء المالي السابق والتوقعات الأساسية.
- نماذج DCF و Ruvered DCF: قوالب شاملة لحساب القيمة الجوهرية لـ YTO Express [600233SS].
- ورقة WACC: الحسابات المدمجة لمتوسط تكلفة رأس المال المرجح.
- مدخلات قابلة للتحرير: اضبط المتغيرات الرئيسية مثل معدلات النمو ، EBITDA ٪ ، وتقديرات CAPEX.
- البيانات الفصلية والسنوية: تحليل شامل لبيانات YTO Express.
- لوحة القيادة التفاعلية: تصور بشكل ديناميكي نتائج التقييم والتوقعات المستقبلية.
Disclaimer
All information, articles, and product details provided on this website are for general informational and educational purposes only. We do not claim any ownership over, nor do we intend to infringe upon, any trademarks, copyrights, logos, brand names, or other intellectual property mentioned or depicted on this site. Such intellectual property remains the property of its respective owners, and any references here are made solely for identification or informational purposes, without implying any affiliation, endorsement, or partnership.
We make no representations or warranties, express or implied, regarding the accuracy, completeness, or suitability of any content or products presented. Nothing on this website should be construed as legal, tax, investment, financial, medical, or other professional advice. In addition, no part of this site—including articles or product references—constitutes a solicitation, recommendation, endorsement, advertisement, or offer to buy or sell any securities, franchises, or other financial instruments, particularly in jurisdictions where such activity would be unlawful.
All content is of a general nature and may not address the specific circumstances of any individual or entity. It is not a substitute for professional advice or services. Any actions you take based on the information provided here are strictly at your own risk. You accept full responsibility for any decisions or outcomes arising from your use of this website and agree to release us from any liability in connection with your use of, or reliance upon, the content or products found herein.