
|
شركة Keda Industrial Group ، Ltd. (600499.SS) تقييم DCF |
Fully Editable: Tailor To Your Needs In Excel Or Sheets
Professional Design: Trusted, Industry-Standard Templates
Investor-Approved Valuation Models
MAC/PC Compatible, Fully Unlocked
No Expertise Is Needed; Easy To Follow
Keda Industrial Group Co., Ltd. (600499.SS) Bundle
سواء كنت مستثمرًا أو محللًا ، فإن حاسبة DCF (600499SS) هي موردك الأساسي للتقييم الدقيق. محملة ببيانات حقيقية من شركة Keda Industrial Group Co. ، Ltd. ، يمكنك ضبط التوقعات ومراقبة التأثيرات فورًا.
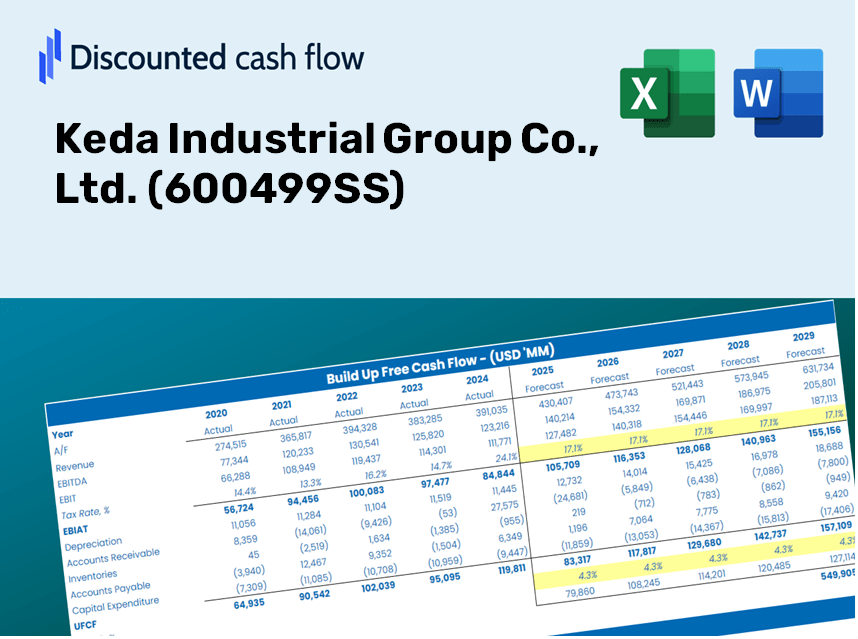
Discounted Cash Flow (DCF) - (USD MM)
| Year | AY1 2020 |
AY2 2021 |
AY3 2022 |
AY4 2023 |
AY5 2024 |
FY1 2025 |
FY2 2026 |
FY3 2027 |
FY4 2028 |
FY5 2029 |
|---|---|---|---|---|---|---|---|---|---|---|
| Revenue | 7,297.6 | 9,796.7 | 11,157.2 | 9,695.6 | 12,600.3 | 14,647.5 | 17,027.4 | 19,793.9 | 23,010.0 | 26,748.6 |
| Revenue Growth, % | 0 | 34.24 | 13.89 | -13.1 | 29.96 | 16.25 | 16.25 | 16.25 | 16.25 | 16.25 |
| EBITDA | 647.3 | 1,386.8 | 1,974.8 | 1,635.6 | 1,797.6 | 2,105.2 | 2,447.2 | 2,844.9 | 3,307.1 | 3,844.4 |
| EBITDA, % | 8.87 | 14.16 | 17.7 | 16.87 | 14.27 | 14.37 | 14.37 | 14.37 | 14.37 | 14.37 |
| Depreciation | 297.0 | 336.3 | 389.7 | 452.3 | 553.9 | 587.5 | 683.0 | 794.0 | 923.0 | 1,072.9 |
| Depreciation, % | 4.07 | 3.43 | 3.49 | 4.66 | 4.4 | 4.01 | 4.01 | 4.01 | 4.01 | 4.01 |
| EBIT | 350.3 | 1,050.5 | 1,585.1 | 1,183.4 | 1,243.7 | 1,517.7 | 1,764.3 | 2,050.9 | 2,384.1 | 2,771.5 |
| EBIT, % | 4.8 | 10.72 | 14.21 | 12.21 | 9.87 | 10.36 | 10.36 | 10.36 | 10.36 | 10.36 |
| Total Cash | 1,457.4 | 2,018.9 | 5,194.8 | 3,893.1 | 3,668.6 | 4,582.0 | 5,326.4 | 6,191.8 | 7,197.9 | 8,367.4 |
| Total Cash, percent | .0 | .0 | .0 | .0 | .0 | .0 | .0 | .0 | .0 | .0 |
| Account Receivables | 2,214.9 | 2,413.8 | 2,746.3 | 3,623.6 | 2,909.2 | 4,103.3 | 4,770.0 | 5,545.0 | 6,445.9 | 7,493.2 |
| Account Receivables, % | 30.35 | 24.64 | 24.61 | 37.37 | 23.09 | 28.01 | 28.01 | 28.01 | 28.01 | 28.01 |
| Inventories | 2,463.1 | 3,262.4 | 3,241.7 | 3,667.7 | 4,794.3 | 5,038.3 | 5,856.9 | 6,808.6 | 7,914.8 | 9,200.8 |
| Inventories, % | 33.75 | 33.3 | 29.05 | 37.83 | 38.05 | 34.4 | 34.4 | 34.4 | 34.4 | 34.4 |
| Accounts Payable | 2,065.9 | 2,656.5 | 2,214.8 | 2,418.4 | 3,389.3 | 3,723.9 | 4,329.0 | 5,032.3 | 5,850.0 | 6,800.4 |
| Accounts Payable, % | 28.31 | 27.12 | 19.85 | 24.94 | 26.9 | 25.42 | 25.42 | 25.42 | 25.42 | 25.42 |
| Capital Expenditure | -307.0 | -548.7 | -993.4 | -1,544.6 | -2,521.3 | -1,601.1 | -1,861.2 | -2,163.6 | -2,515.1 | -2,923.8 |
| Capital Expenditure, % | -4.21 | -5.6 | -8.9 | -15.93 | -20.01 | -10.93 | -10.93 | -10.93 | -10.93 | -10.93 |
| Tax Rate, % | 27.71 | 27.71 | 27.71 | 27.71 | 27.71 | 27.71 | 27.71 | 27.71 | 27.71 | 27.71 |
| EBITAT | 204.9 | 708.0 | 1,268.3 | 939.9 | 899.0 | 1,085.5 | 1,261.9 | 1,466.9 | 1,705.2 | 1,982.3 |
| Depreciation | ||||||||||
| Changes in Account Receivables | ||||||||||
| Changes in Inventories | ||||||||||
| Changes in Accounts Payable | ||||||||||
| Capital Expenditure | ||||||||||
| UFCF | -2,417.2 | 88.1 | -88.9 | -1,252.2 | -509.7 | -1,031.5 | -796.6 | -926.0 | -1,076.5 | -1,251.4 |
| WACC, % | 10.03 | 10.1 | 10.21 | 10.2 | 10.14 | 10.13 | 10.13 | 10.13 | 10.13 | 10.13 |
| PV UFCF | ||||||||||
| SUM PV UFCF | -3,790.4 | |||||||||
| Long Term Growth Rate, % | 3.50 | |||||||||
| Free cash flow (T + 1) | -1,295 | |||||||||
| Terminal Value | -19,522 | |||||||||
| Present Terminal Value | -12,048 | |||||||||
| Enterprise Value | -15,838 | |||||||||
| Net Debt | 2,087 | |||||||||
| Equity Value | -17,925 | |||||||||
| Diluted Shares Outstanding, MM | 1,884 | |||||||||
| Equity Value Per Share | -9.51 |
الفوائد التي ستحصل عليها
- النموذج المالي الشامل: الاستفادة من البيانات الفعلية لمجموعة Keda الصناعية للتقييم الدقيق لـ DCF.
- التحكم الكامل في التنبؤ: تعديل نمو الإيرادات وهوامش الربح و WACC وعوامل حاسمة أخرى.
- حسابات الوقت الفعلي: توفر التحديثات التلقائية ملاحظات فورية أثناء ضبط المدخلات.
- نموذج الدرجة المهنية: ملف Excel مصقول مصمم لعروض تقديمية قوية.
- مرنة وقابلة لإعادة الاستخدام: مصممة للتكيف، مما يتيح الاستخدام المتسق للتنبؤ المتعمق.
الميزات الرئيسية
- البيانات المحملة مسبقًا: البيانات المالية التاريخية والتوقعات المعبأة مسبقًا لشركة Keda Industrial Group Co.، Ltd. (600499SS).
- المدخلات القابلة للتعديل بالكامل: خصص WACC ومعدلات الضرائب ونمو الإيرادات وهوامش الأرباح قبل الفوائد والضرائب والإهلاك والاستهلاك وفقًا لتحليلك.
- النتائج الفورية: راقب شركة Keda Industrial Group Co.، Ltd. (600499SS) إعادة حساب القيمة الجوهرية في الوقت الفعلي.
- المخرجات المرئية الواضحة: تعرض مخططات لوحة القيادة التفاعلية نتائج التقييم والمقاييس الأساسية.
- تم تصميمه من أجل الدقة: أداة موثوقة مصممة للمحللين والمستثمرين والمهنيين الماليين.
كيف تعمل
- الخطوة 1: قم بتنزيل قالب Excel Prebuilt الذي يتضمن بيانات لشركة Keda Industrial Group Co. ، Ltd. (600499SS).
- الخطوة 2: راجع الأوراق المملوءة مسبقًا للتعرف على مؤشرات الأداء الرئيسية.
- الخطوة 3: تعديل التوقعات والافتراضات في الخلايا الصفراء القابلة للتحرير (WACC ، النمو ، الهوامش).
- الخطوة 4: انظر النتائج المعاد حسابها في الوقت الحقيقي ، بما في ذلك القيمة الجوهرية لمجموعة Keda الصناعية.
- الخطوة 5: الاستفادة من المخرجات لاتخاذ خيارات استثمار مستنيرة أو إنشاء تقارير.
لماذا تختار شركة Keda Industrial Group Co. ، Ltd. (600499SS)؟
- دقة: يستخدم البيانات المالية الدقيقة الخاصة بـ KEDA Industrial.
- القدرة على التكيف: يمكن للمستخدمين تخصيص وتجربة مختلف المدخلات.
- كفاءة: إلغاء الحاجة إلى إنشاء نموذج مالي من الألف إلى الياء.
- المعايير العالية: مصنوع من رؤى ومعايير خبراء الصناعة.
- تصميم بديهي: سهل التنقل ، حتى بالنسبة لأولئك الجدد إلى التحليل المالي.
من يجب أن يستخدم هذا المنتج؟
- المستثمرون: تقييم بدقة القيمة العادلة لشركة Keda Industrial Group Co. ، Ltd. (600499SS) قبل المتابعة مع خيارات الاستثمار.
- المدير المالي: الاستفادة من نموذج DCF من الدرجة المهنية للتقارير المالية الشاملة والتحليل المتعلق بـ KEDA Industrial Group Co. ، Ltd. (600499SS).
- الاستشاريون: تعديل القالب بفعالية لتقارير تقييم العميل التي تشمل KEDA Industrial Group Co. ، Ltd. (600499SS).
- رواد الأعمال: اكتساب رؤى حول ممارسات النمذجة المالية التي يعملها قادة الصناعة ، بما في ذلك Keda Industrial Group Co. ، Ltd. (600499SS).
- المعلمون: استخدم هذه الأداة لتوضيح منهجيات التقييم في الإعدادات الأكاديمية ، مع التركيز على KEDA Industrial Group Co. ، Ltd. (600499SS).
محتويات النموذج
- نموذج DCF الشامل: نموذج قابل للتحرير يتميز بحسابات تقييم متعمقة.
- بيانات العالم الحقيقي: تم تحميل البيانات المالية التاريخية والمتوقعة لمجموعة كيدا الصناعية مسبقًا لتحليلها بدقة.
- المعلمات القابلة للتخصيص: تعديل WACC ومعدلات النمو والافتراضات الضريبية لاستكشاف سيناريوهات مختلفة.
- البيانات المالية استكمال الأعطال السنوية والفصلية لتحسين الرؤى.
- النسب الرئيسية: تحليل متكامل لتقييم الربحية والكفاءة والنفوذ.
- لوحة القيادة مع المخرجات المرئية: الرسوم البيانية والجداول توفر رؤى واضحة وقابلة للتنفيذ.
Disclaimer
All information, articles, and product details provided on this website are for general informational and educational purposes only. We do not claim any ownership over, nor do we intend to infringe upon, any trademarks, copyrights, logos, brand names, or other intellectual property mentioned or depicted on this site. Such intellectual property remains the property of its respective owners, and any references here are made solely for identification or informational purposes, without implying any affiliation, endorsement, or partnership.
We make no representations or warranties, express or implied, regarding the accuracy, completeness, or suitability of any content or products presented. Nothing on this website should be construed as legal, tax, investment, financial, medical, or other professional advice. In addition, no part of this site—including articles or product references—constitutes a solicitation, recommendation, endorsement, advertisement, or offer to buy or sell any securities, franchises, or other financial instruments, particularly in jurisdictions where such activity would be unlawful.
All content is of a general nature and may not address the specific circumstances of any individual or entity. It is not a substitute for professional advice or services. Any actions you take based on the information provided here are strictly at your own risk. You accept full responsibility for any decisions or outcomes arising from your use of this website and agree to release us from any liability in connection with your use of, or reliance upon, the content or products found herein.