
|
ACM Research ، Inc. (688082.SS) DCF تقييم |
Fully Editable: Tailor To Your Needs In Excel Or Sheets
Professional Design: Trusted, Industry-Standard Templates
Investor-Approved Valuation Models
MAC/PC Compatible, Fully Unlocked
No Expertise Is Needed; Easy To Follow
ACM Research (Shanghai), Inc. (688082.SS) Bundle
تبسيط التحليل الخاص بك وزيادة الدقة مع حاسبة (688082SS) DCF! باستخدام بيانات حقيقية من ACM Research (Shanghai) ، Inc. والافتراضات القابلة للتخصيص ، فإن هذه الأداة تمكنك من التنبؤ وتحليل وقيمة أبحاث ACM مثل المستثمر المحنك.
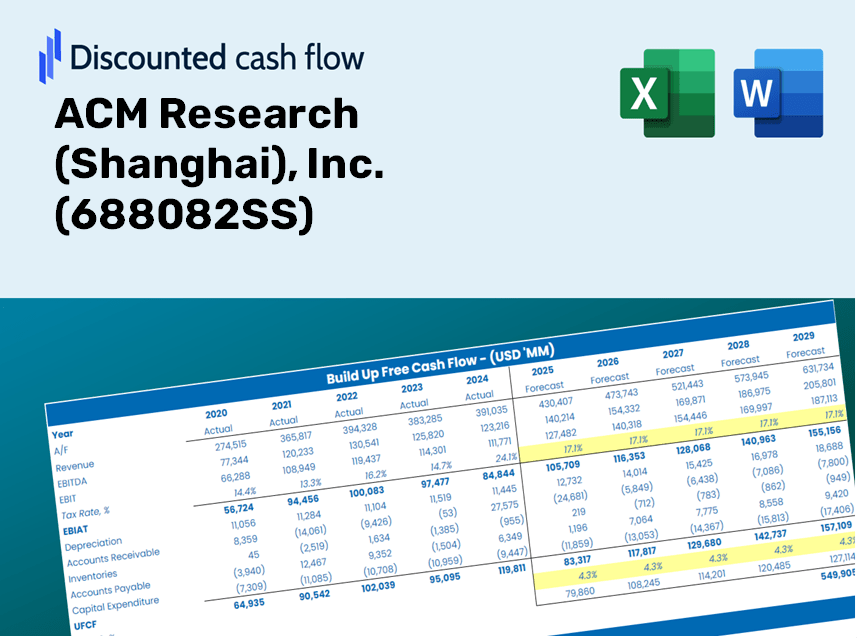
Discounted Cash Flow (DCF) - (USD MM)
| Year | AY1 2020 |
AY2 2021 |
AY3 2022 |
AY4 2023 |
AY5 2024 |
FY1 2025 |
FY2 2026 |
FY3 2027 |
FY4 2028 |
FY5 2029 |
|---|---|---|---|---|---|---|---|---|---|---|
| Revenue | 1,007.5 | 1,620.9 | 2,873.0 | 3,888.3 | 5,617.7 | 8,678.8 | 13,407.7 | 20,713.3 | 31,999.6 | 49,435.7 |
| Revenue Growth, % | 0 | 60.88 | 77.25 | 35.34 | 44.48 | 54.49 | 54.49 | 54.49 | 54.49 | 54.49 |
| EBITDA | 145.8 | 185.2 | 641.3 | 870.4 | 1,247.0 | 1,610.7 | 2,488.4 | 3,844.3 | 5,938.9 | 9,175.0 |
| EBITDA, % | 14.47 | 11.43 | 22.32 | 22.38 | 22.2 | 18.56 | 18.56 | 18.56 | 18.56 | 18.56 |
| Depreciation | 4.7 | 8.8 | 21.9 | 47.9 | 49.4 | 67.3 | 104.0 | 160.7 | 248.2 | 383.5 |
| Depreciation, % | 0.46284 | 0.54189 | 0.76368 | 1.23 | 0.87851 | 0.77566 | 0.77566 | 0.77566 | 0.77566 | 0.77566 |
| EBIT | 141.1 | 176.4 | 619.3 | 822.5 | 1,197.7 | 1,543.4 | 2,384.4 | 3,683.6 | 5,690.7 | 8,791.5 |
| EBIT, % | 14 | 10.89 | 21.56 | 21.15 | 21.32 | 17.78 | 17.78 | 17.78 | 17.78 | 17.78 |
| Total Cash | 455.5 | 3,590.7 | 1,703.1 | 1,664.6 | 2,772.7 | 5,149.2 | 7,954.9 | 12,289.4 | 18,985.7 | 29,330.6 |
| Total Cash, percent | .0 | .0 | .0 | .0 | .0 | .0 | .0 | .0 | .0 | .0 |
| Account Receivables | 290.8 | 653.6 | 1,157.2 | 1,610.0 | 2,236.3 | 3,309.7 | 5,113.1 | 7,899.1 | 12,203.2 | 18,852.5 |
| Account Receivables, % | 28.86 | 40.32 | 40.28 | 41.41 | 39.81 | 38.14 | 38.14 | 38.14 | 38.14 | 38.14 |
| Inventories | 614.9 | 1,443.3 | 2,689.8 | 3,925.3 | 4,232.2 | 7,273.4 | 11,236.6 | 17,359.2 | 26,818.0 | 41,430.6 |
| Inventories, % | 61.03 | 89.05 | 93.62 | 100.95 | 75.34 | 83.81 | 83.81 | 83.81 | 83.81 | 83.81 |
| Accounts Payable | 291.9 | 733.4 | 961.4 | 1,491.1 | 1,488.3 | 2,994.7 | 4,626.5 | 7,147.4 | 11,042.0 | 17,058.5 |
| Accounts Payable, % | 28.98 | 45.25 | 33.46 | 38.35 | 26.49 | 34.51 | 34.51 | 34.51 | 34.51 | 34.51 |
| Capital Expenditure | -355.4 | -59.6 | -685.6 | -398.4 | -573.8 | -1,445.6 | -2,233.2 | -3,450.1 | -5,330.0 | -8,234.2 |
| Capital Expenditure, % | -35.28 | -3.68 | -23.86 | -10.25 | -10.21 | -16.66 | -16.66 | -16.66 | -16.66 | -16.66 |
| Tax Rate, % | 11.34 | 11.34 | 11.34 | 11.34 | 11.34 | 11.34 | 11.34 | 11.34 | 11.34 | 11.34 |
| EBITAT | 124.5 | 174.8 | 577.7 | 777.0 | 1,061.9 | 1,431.4 | 2,211.3 | 3,416.2 | 5,277.6 | 8,153.3 |
| Depreciation | ||||||||||
| Changes in Account Receivables | ||||||||||
| Changes in Inventories | ||||||||||
| Changes in Accounts Payable | ||||||||||
| Capital Expenditure | ||||||||||
| UFCF | -840.0 | -625.8 | -1,608.1 | -732.1 | -398.7 | -2,555.1 | -4,052.7 | -6,261.0 | -9,672.5 | -14,942.8 |
| WACC, % | 5.5 | 5.51 | 5.5 | 5.51 | 5.5 | 5.5 | 5.5 | 5.5 | 5.5 | 5.5 |
| PV UFCF | ||||||||||
| SUM PV UFCF | -30,631.0 | |||||||||
| Long Term Growth Rate, % | 2.00 | |||||||||
| Free cash flow (T + 1) | -15,242 | |||||||||
| Terminal Value | -434,900 | |||||||||
| Present Terminal Value | -332,684 | |||||||||
| Enterprise Value | -363,315 | |||||||||
| Net Debt | -1,619 | |||||||||
| Equity Value | -361,696 | |||||||||
| Diluted Shares Outstanding, MM | 442 | |||||||||
| Equity Value Per Share | -818.62 |
ما ستناله
- دقة ACM المالية: الوصول إلى البيانات التاريخية والمسقطة من أجل تقييم موثوق.
- المدخلات القابلة للتخصيص: قم بتعديل WACC ومعدلات الضرائب ونمو الإيرادات والنفقات الرأسمالية حسب الحاجة.
- الحسابات الفورية: يتم حساب القيمة الجوهرية و NPV ديناميكيًا لراحتك.
- تحليل السيناريو: تقييم السيناريوهات المختلفة لتقييم الأداء المستقبلي لـ ACM.
- تصميم سهل الاستخدام: مصمم للمحترفين ولكنه سهل بما يكفي للمبتدئين للتنقل.
الميزات الرئيسية
- بيانات ACM في الوقت الحقيقي: تم تحميلها مسبقًا مع البيانات المالية التاريخية لـ ACM Research والتوقعات المستقبلية.
- المعلمات القابلة للتخصيص: نمو إيرادات الخياطة ، هوامش الربح ، معدلات الخصم ، معدلات الضرائب ، والنفقات الرأسمالية لاحتياجاتك.
- نموذج التقييم التفاعلي: عمليات إعادة حساب تلقائية للقيمة الحالية الصافية (NPV) والقيمة الجوهرية بناءً على التعديلات الخاصة بك.
- تحليل السيناريو: تطوير سيناريوهات التنبؤ المختلفة لتقييم نتائج التقييم المختلفة.
- واجهة سهلة الاستخدام: بديهية ومنظمة ، مناسبة لكل من المهنيين والمبتدئين.
كيف تعمل
- الخطوة 1: قم بتنزيل ملف Excel.
- الخطوة 2: فحص البيانات المملوءة مسبقًا لـ ACM Research (Shanghai) ، Inc. (688082SS) (التاريخية والمتوقعة).
- الخطوة 3: تعديل الافتراضات الرئيسية (الخلايا المميزة) بناءً على تحليلك.
- الخطوة 4: راقب التحديثات التلقائية لأبحاث ACM (Shanghai) ، Inc. (688082SS) القيمة الجوهرية.
- الخطوة 5: الاستفادة من نتائج قرارات الاستثمار أو التقارير.
لماذا تختار هذه الآلة الحاسبة؟
- بيانات دقيقة: Access Precise ACM Research (Shanghai) ، Inc. (688082SS) Financial لنتائج التقييم الجديرة بالثقة.
- قابل للتخصيص: تخصيص المتغيرات الأساسية مثل معدلات النمو و WACC ومعدلات الضرائب لتتماشى مع توقعاتك.
- توفير الوقت: تساعدك العمليات الحسابية التي تم تكوينها مسبقًا على تجنب البدء من الألف إلى الياء.
- أداة الصفوف المهنية: صُنعت للمستثمرين والمحللين والمستشارين على حد سواء.
- سهل الاستخدام: التصميم سهل التنقل والإرشادات الواضحة تجعله في متناول جميع المستخدمين.
من يمكنه الاستفادة من هذا المنتج؟
- المستثمرون المؤسسيون: تطوير نماذج تقييم شاملة ودقيقة لتقييم أبحاث ACM (688082SS).
- إدارات تمويل الشركات: تقييم سيناريوهات التقييم لإبلاغ التخطيط الاستراتيجي.
- المستشارون والمستشارون الماليون: تقديم تحليل دقيق للتقييم للعملاء المهتمين بأبحاث ACM (688082SS).
- الطلاب والمعلمين: الاستفادة من بيانات العالم الحقيقي للتدريب والتعليم في النمذجة المالية.
- محللي التكنولوجيا: استكشف طرق تقييم الشركات التقنية الرائدة مثل ACM Research (688082SS).
محتويات القالب
- البيانات التاريخية: يوفر الأداء المالي السابق لـ ACM Research والتوقعات التأسيسية.
- نماذج DCF و Ruvered DCF: قوالب شاملة مصممة لتقييم القيمة الجوهرية لـ ACM Research.
- ورقة WACC: الحسابات المسببة للتشكيل لمتوسط تكلفة رأس المال المرجح.
- مدخلات قابلة للتحرير: اضبط المتغيرات الأساسية مثل معدلات النمو ، والنسب المئوية EBITDA ، وافتراضات Capex.
- البيانات الفصلية والسنوية: متعمق overview من بيانات ACM Research المالية.
- لوحة القيادة التفاعلية: تصور ديناميكيا نتائج التقييم والتوقعات.
Disclaimer
All information, articles, and product details provided on this website are for general informational and educational purposes only. We do not claim any ownership over, nor do we intend to infringe upon, any trademarks, copyrights, logos, brand names, or other intellectual property mentioned or depicted on this site. Such intellectual property remains the property of its respective owners, and any references here are made solely for identification or informational purposes, without implying any affiliation, endorsement, or partnership.
We make no representations or warranties, express or implied, regarding the accuracy, completeness, or suitability of any content or products presented. Nothing on this website should be construed as legal, tax, investment, financial, medical, or other professional advice. In addition, no part of this site—including articles or product references—constitutes a solicitation, recommendation, endorsement, advertisement, or offer to buy or sell any securities, franchises, or other financial instruments, particularly in jurisdictions where such activity would be unlawful.
All content is of a general nature and may not address the specific circumstances of any individual or entity. It is not a substitute for professional advice or services. Any actions you take based on the information provided here are strictly at your own risk. You accept full responsibility for any decisions or outcomes arising from your use of this website and agree to release us from any liability in connection with your use of, or reliance upon, the content or products found herein.