
|
AllianceBernstein Holding L.P. (AB) DCF تقييم |
Fully Editable: Tailor To Your Needs In Excel Or Sheets
Professional Design: Trusted, Industry-Standard Templates
Investor-Approved Valuation Models
MAC/PC Compatible, Fully Unlocked
No Expertise Is Needed; Easy To Follow
AllianceBernstein Holding L.P. (AB) Bundle
هندسة من أجل الدقة ، تمكنك حاسبة DCF الخاصة بنا من تقييم AllianceBernstein Holding L.P.
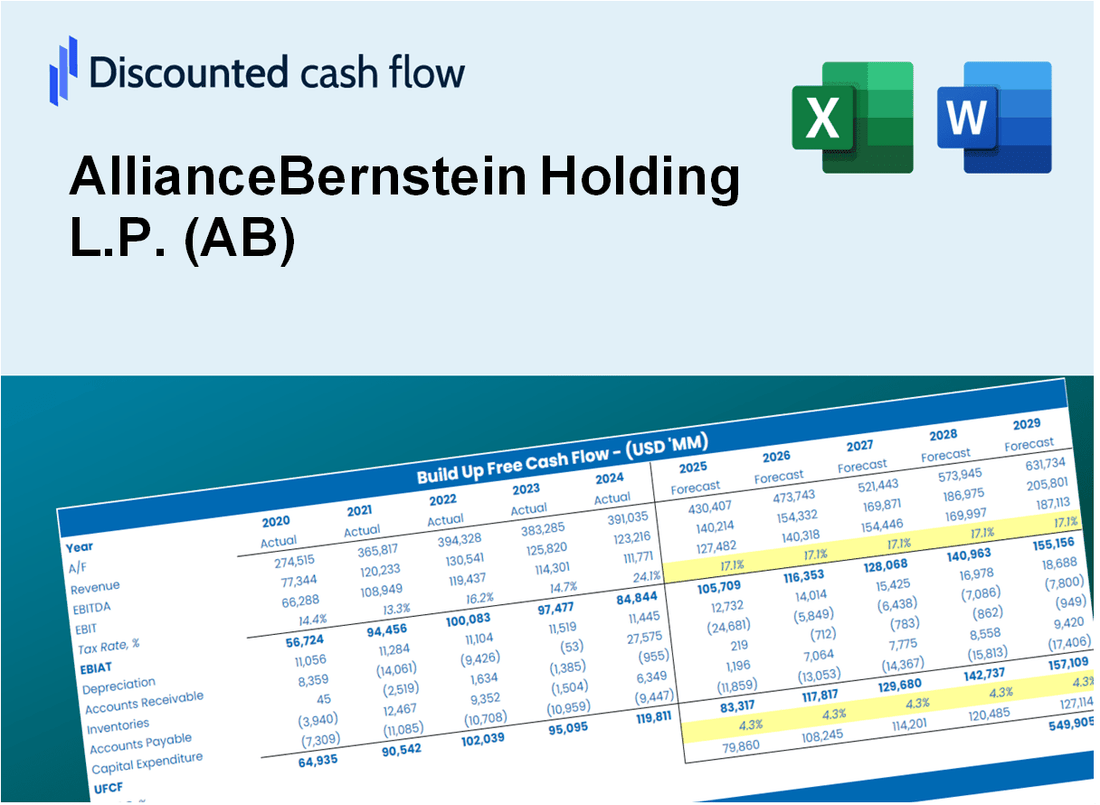
Discounted Cash Flow (DCF) - (USD MM)
| Year | AY1 2020 |
AY2 2021 |
AY3 2022 |
AY4 2023 |
AY5 2024 |
FY1 2025 |
FY2 2026 |
FY3 2027 |
FY4 2028 |
FY5 2029 |
|---|---|---|---|---|---|---|---|---|---|---|
| Revenue | 308.4 | 4,445.3 | 305.5 | 299.8 | 4,559.7 | 5,756.6 | 7,267.6 | 9,175.4 | 11,583.9 | 14,624.6 |
| Revenue Growth, % | 0 | 1341.38 | -93.13 | -1.87 | 1420.99 | 26.25 | 26.25 | 26.25 | 26.25 | 26.25 |
| EBITDA | 1,056.2 | 1,259.3 | 1,013.8 | 1,043.3 | 1,124.1 | 4,063.9 | 5,130.7 | 6,477.5 | 8,177.8 | 10,324.5 |
| EBITDA, % | 342.49 | 28.33 | 331.85 | 348.03 | 24.65 | 70.6 | 70.6 | 70.6 | 70.6 | 70.6 |
| Depreciation | 1,056.2 | 1,259.3 | 1,013.8 | 1,043.3 | -133.7 | 3,746.3 | 4,729.7 | 5,971.3 | 7,538.7 | 9,517.6 |
| Depreciation, % | 342.49 | 28.33 | 331.85 | 348.03 | -2.93 | 65.08 | 65.08 | 65.08 | 65.08 | 65.08 |
| EBIT | .0 | .0 | .0 | .0 | 1,257.8 | 317.6 | 400.9 | 506.2 | 639.1 | 806.8 |
| EBIT, % | 0 | 0 | 0 | 0 | 27.58 | 5.52 | 5.52 | 5.52 | 5.52 | 5.52 |
| Total Cash | .0 | .0 | 41.7 | 153.0 | 832.0 | 955.1 | 1,205.8 | 1,522.3 | 1,922.0 | 2,426.5 |
| Total Cash, percent | .0 | .0 | .0 | .0 | .0 | .0 | .0 | .0 | .0 | .0 |
| Account Receivables | .0 | .0 | 82.5 | .0 | .0 | 311.0 | 392.6 | 495.7 | 625.8 | 790.1 |
| Account Receivables, % | 0 | 0 | 27.01 | 0 | 0 | 5.4 | 5.4 | 5.4 | 5.4 | 5.4 |
| Inventories | .0 | .0 | .0 | .0 | .0 | .0 | .0 | .0 | .0 | .0 |
| Inventories, % | 0 | 0 | 0 | 0 | 0 | 0 | 0 | 0 | 0 | 0 |
| Accounts Payable | .0 | .0 | .0 | .0 | .0 | .0 | .0 | .0 | .0 | .0 |
| Accounts Payable, % | 0 | 0 | 0 | 0 | 0 | 0 | 0 | 0 | 0 | 0 |
| Capital Expenditure | -41.5 | -61.9 | -62.3 | -33.6 | -122.3 | -565.8 | -714.4 | -901.9 | -1,138.6 | -1,437.5 |
| Capital Expenditure, % | -13.46 | -1.39 | -20.4 | -11.22 | -2.68 | -9.83 | -9.83 | -9.83 | -9.83 | -9.83 |
| Tax Rate, % | 8.35 | 8.35 | 8.35 | 8.35 | 8.35 | 8.35 | 8.35 | 8.35 | 8.35 | 8.35 |
| EBITAT | .0 | .0 | .0 | .0 | 1,152.7 | 287.6 | 363.1 | 458.4 | 578.7 | 730.6 |
| Depreciation | ||||||||||
| Changes in Account Receivables | ||||||||||
| Changes in Inventories | ||||||||||
| Changes in Accounts Payable | ||||||||||
| Capital Expenditure | ||||||||||
| UFCF | 1,014.7 | 1,197.4 | 869.0 | 1,092.2 | 896.7 | 3,157.1 | 4,296.8 | 5,424.7 | 6,848.7 | 8,646.5 |
| WACC, % | 7.71 | 7.71 | 7.71 | 7.71 | 7.71 | 7.71 | 7.71 | 7.71 | 7.71 | 7.71 |
| PV UFCF | ||||||||||
| SUM PV UFCF | 22,029.1 | |||||||||
| Long Term Growth Rate, % | 2.00 | |||||||||
| Free cash flow (T + 1) | 8,819 | |||||||||
| Terminal Value | 154,469 | |||||||||
| Present Terminal Value | 106,554 | |||||||||
| Enterprise Value | 128,583 | |||||||||
| Net Debt | -832 | |||||||||
| Equity Value | 129,415 | |||||||||
| Diluted Shares Outstanding, MM | 114 | |||||||||
| Equity Value Per Share | 1,134.80 |
What You Will Receive
- Authentic AB Financial Data: Pre-loaded with AllianceBernstein’s historical and forecasted data for detailed analysis.
- Completely Customizable Template: Easily adjust key parameters such as revenue growth, WACC, and EBITDA %.
- Instant Calculations: Watch AllianceBernstein’s intrinsic value refresh in real-time as you make adjustments.
- Expert Valuation Tool: Tailored for investors, analysts, and consultants aiming for precise DCF outcomes.
- Intuitive Design: Clear layout and straightforward instructions suitable for users of all skill levels.
Key Features
- Comprehensive Data: AllianceBernstein's historical financial records and pre-filled projections.
- Customizable Parameters: Modify WACC, tax rates, revenue growth, and EBITDA margins.
- Real-Time Insights: Observe AllianceBernstein's intrinsic value adjust instantly.
- Intuitive Visualizations: Dashboard graphs present valuation outcomes and essential metrics.
- Designed for Precision: A sophisticated tool for analysts, investors, and finance professionals.
How It Works
- Step 1: Download the prebuilt Excel template featuring AllianceBernstein Holding L.P. (AB) data.
- Step 2: Navigate through the pre-filled sheets to grasp the essential metrics.
- Step 3: Adjust forecasts and assumptions in the editable yellow cells (WACC, growth, margins).
- Step 4: Instantly see recalculated results, including AllianceBernstein's intrinsic value.
- Step 5: Make informed investment choices or create reports based on the outputs.
Why Choose This Calculator?
- Accuracy: Leverages real AllianceBernstein financials for precise data.
- Flexibility: Allows users to easily test and adjust inputs as needed.
- Time-Saving: Eliminates the need to create a DCF model from the ground up.
- Professional-Grade: Crafted with the expertise and usability expected at the CFO level.
- User-Friendly: Intuitive interface designed for users of all financial backgrounds.
Who Should Use AllianceBernstein Holding L.P. (AB)?
- Investors: Evaluate AllianceBernstein's performance and potential before making investment decisions.
- CFOs and Financial Analysts: Optimize financial analysis and reporting processes for better insights.
- Portfolio Managers: Understand the impact of market trends on AllianceBernstein’s investment strategies.
- Consultants: Provide informed recommendations and analysis based on AllianceBernstein's market position.
- Students and Educators: Utilize real-time data to teach and learn about asset management and investment strategies.
What the Template Contains
- Operating and Balance Sheet Data: Pre-filled AllianceBernstein Holding L.P. (AB) historical data and forecasts, including revenue, EBITDA, EBIT, and capital expenditures.
- WACC Calculation: A dedicated sheet for Weighted Average Cost of Capital (WACC), including parameters like Beta, risk-free rate, and share price.
- DCF Valuation (Unlevered and Levered): Editable Discounted Cash Flow models showing intrinsic value with detailed calculations.
- Financial Statements: Pre-loaded financial statements (annual and quarterly) to support analysis.
- Key Ratios: Includes profitability, leverage, and efficiency ratios for AllianceBernstein Holding L.P. (AB).
- Dashboard and Charts: Visual summary of valuation outputs and assumptions to analyze results easily.
Disclaimer
All information, articles, and product details provided on this website are for general informational and educational purposes only. We do not claim any ownership over, nor do we intend to infringe upon, any trademarks, copyrights, logos, brand names, or other intellectual property mentioned or depicted on this site. Such intellectual property remains the property of its respective owners, and any references here are made solely for identification or informational purposes, without implying any affiliation, endorsement, or partnership.
We make no representations or warranties, express or implied, regarding the accuracy, completeness, or suitability of any content or products presented. Nothing on this website should be construed as legal, tax, investment, financial, medical, or other professional advice. In addition, no part of this site—including articles or product references—constitutes a solicitation, recommendation, endorsement, advertisement, or offer to buy or sell any securities, franchises, or other financial instruments, particularly in jurisdictions where such activity would be unlawful.
All content is of a general nature and may not address the specific circumstances of any individual or entity. It is not a substitute for professional advice or services. Any actions you take based on the information provided here are strictly at your own risk. You accept full responsibility for any decisions or outcomes arising from your use of this website and agree to release us from any liability in connection with your use of, or reliance upon, the content or products found herein.