
|
Accel Entertainment، Inc. (ACEL) تقييم DCF |
Fully Editable: Tailor To Your Needs In Excel Or Sheets
Professional Design: Trusted, Industry-Standard Templates
Investor-Approved Valuation Models
MAC/PC Compatible, Fully Unlocked
No Expertise Is Needed; Easy To Follow
Accel Entertainment, Inc. (ACEL) Bundle
قم بتبسيط تحليلك وتعزيز الدقة باستخدام حاسبة DCF (ACEL)! مجهزة ببيانات Accel Entertainment الحقيقية والافتراضات القابلة للتخصيص، تمكنك هذه الأداة من التنبؤ بـ Accel Entertainment وتحليلها وتقييمها كمستثمر متمرس.
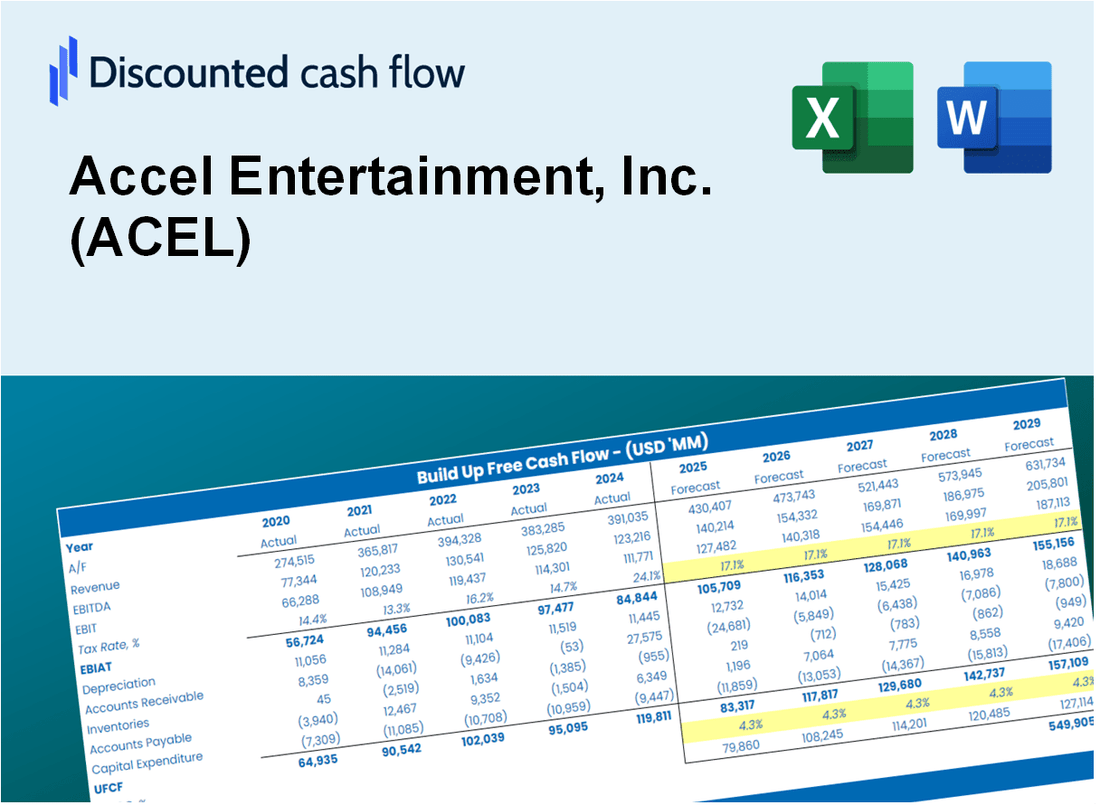
Discounted Cash Flow (DCF) - (USD MM)
| Year | AY1 2020 |
AY2 2021 |
AY3 2022 |
AY4 2023 |
AY5 2024 |
FY1 2025 |
FY2 2026 |
FY3 2027 |
FY4 2028 |
FY5 2029 |
|---|---|---|---|---|---|---|---|---|---|---|
| Revenue | 316.4 | 734.7 | 969.8 | 1,170.4 | 1,231.0 | 1,716.8 | 2,394.3 | 3,339.2 | 4,657.0 | 6,494.8 |
| Revenue Growth, % | 0 | 132.24 | 32 | 20.69 | 5.17 | 39.46 | 39.46 | 39.46 | 39.46 | 39.46 |
| EBITDA | 40.0 | 106.0 | 163.2 | 158.0 | 156.2 | 240.6 | 335.5 | 467.9 | 652.6 | 910.1 |
| EBITDA, % | 12.63 | 14.42 | 16.83 | 13.5 | 12.69 | 14.01 | 14.01 | 14.01 | 14.01 | 14.01 |
| Depreciation | 43.6 | 46.7 | 46.8 | 59.1 | 66.6 | 121.6 | 169.6 | 236.5 | 329.8 | 460.0 |
| Depreciation, % | 13.77 | 6.35 | 4.82 | 5.05 | 5.41 | 7.08 | 7.08 | 7.08 | 7.08 | 7.08 |
| EBIT | -3.6 | 59.3 | 116.4 | 98.9 | 89.6 | 119.0 | 165.9 | 231.4 | 322.8 | 450.1 |
| EBIT, % | -1.14 | 8.07 | 12 | 8.45 | 7.28 | 6.93 | 6.93 | 6.93 | 6.93 | 6.93 |
| Total Cash | 134.5 | 230.9 | 256.2 | 261.6 | 281.3 | 499.7 | 696.9 | 972.0 | 1,355.6 | 1,890.5 |
| Total Cash, percent | .0 | .0 | .0 | .0 | .0 | .0 | .0 | .0 | .0 | .0 |
| Account Receivables | 3.3 | 5.1 | 11.2 | 13.5 | 10.6 | 16.9 | 23.5 | 32.8 | 45.8 | 63.8 |
| Account Receivables, % | 1.06 | 0.69701 | 1.15 | 1.15 | 0.85705 | 0.98243 | 0.98243 | 0.98243 | 0.98243 | 0.98243 |
| Inventories | .0 | .0 | 6.9 | 7.7 | 8.1 | 7.0 | 9.7 | 13.6 | 18.9 | 26.4 |
| Inventories, % | 0 | 0 | 0.71572 | 0.65626 | 0.6598 | 0.40636 | 0.40636 | 0.40636 | 0.40636 | 0.40636 |
| Accounts Payable | 23.7 | 14.6 | 22.3 | 33.5 | 41.9 | 61.9 | 86.4 | 120.5 | 168.0 | 234.4 |
| Accounts Payable, % | 7.48 | 1.99 | 2.3 | 2.86 | 3.41 | 3.61 | 3.61 | 3.61 | 3.61 | 3.61 |
| Capital Expenditure | -25.8 | -29.8 | -47.4 | -81.7 | -66.5 | -101.2 | -141.1 | -196.8 | -274.5 | -382.8 |
| Capital Expenditure, % | -8.14 | -4.05 | -4.89 | -6.98 | -5.41 | -5.89 | -5.89 | -5.89 | -5.89 | -5.89 |
| Tax Rate, % | 34.39 | 34.39 | 34.39 | 34.39 | 34.39 | 34.39 | 34.39 | 34.39 | 34.39 | 34.39 |
| EBITAT | -.1 | 40.2 | 91.0 | 68.6 | 58.8 | 67.4 | 94.0 | 131.1 | 182.9 | 255.1 |
| Depreciation | ||||||||||
| Changes in Account Receivables | ||||||||||
| Changes in Inventories | ||||||||||
| Changes in Accounts Payable | ||||||||||
| Capital Expenditure | ||||||||||
| UFCF | 38.1 | 46.3 | 85.1 | 54.2 | 69.7 | 102.7 | 137.5 | 191.8 | 267.5 | 373.0 |
| WACC, % | 5.31 | 6.91 | 7.17 | 6.95 | 6.86 | 6.64 | 6.64 | 6.64 | 6.64 | 6.64 |
| PV UFCF | ||||||||||
| SUM PV UFCF | 852.6 | |||||||||
| Long Term Growth Rate, % | 1.00 | |||||||||
| Free cash flow (T + 1) | 377 | |||||||||
| Terminal Value | 6,678 | |||||||||
| Present Terminal Value | 4,842 | |||||||||
| Enterprise Value | 5,695 | |||||||||
| Net Debt | 314 | |||||||||
| Equity Value | 5,380 | |||||||||
| Diluted Shares Outstanding, MM | 85 | |||||||||
| Equity Value Per Share | 63.32 |
What You Will Get
- Pre-Filled Financial Model: Accel Entertainment’s actual data facilitates accurate DCF valuation.
- Comprehensive Forecast Control: Modify revenue growth, margins, WACC, and other essential drivers.
- Real-Time Calculations: Automatic updates provide instant results as you make adjustments.
- Professional-Grade Template: A polished Excel file crafted for high-quality valuation.
- Flexible and Reusable: Designed for adaptability, allowing multiple uses for in-depth forecasts.
Key Features
- Comprehensive DCF Calculator: Features both unlevered and levered DCF valuation models tailored for Accel Entertainment, Inc. (ACEL).
- WACC Calculator: Ready-to-use Weighted Average Cost of Capital sheet with adjustable parameters.
- Customizable Forecast Assumptions: Adjust growth rates, capital expenditures, and discount rates as needed.
- Integrated Financial Ratios: Examine profitability, leverage, and efficiency ratios specifically for Accel Entertainment, Inc. (ACEL).
- Visual Dashboard and Charts: Graphical representations that highlight essential valuation metrics for straightforward analysis.
How It Works
- Step 1: Download the prebuilt Excel template with Accel Entertainment, Inc.'s (ACEL) data included.
- Step 2: Explore the pre-filled sheets and familiarize yourself with the key performance indicators.
- Step 3: Update forecasts and assumptions in the editable yellow cells (WACC, growth, margins).
- Step 4: Instantly view recalculated results, including Accel Entertainment, Inc.'s (ACEL) intrinsic value.
- Step 5: Make informed investment decisions or generate reports based on the outputs.
Why Choose This Calculator for Accel Entertainment, Inc. (ACEL)?
- Comprehensive Tool: Integrates DCF, WACC, and financial ratio analyses tailored for the gaming industry.
- Customizable Inputs: Modify yellow-highlighted cells to explore different financial scenarios for Accel Entertainment.
- Detailed Insights: Automatically computes Accel Entertainment’s intrinsic value and Net Present Value.
- Preloaded Data: Historical and projected data provide reliable starting points for analysis.
- Professional Quality: Perfect for financial analysts, investors, and business consultants focusing on the gaming sector.
Who Should Use This Product?
- Individual Investors: Make informed decisions about buying or selling Accel Entertainment, Inc. (ACEL) stock.
- Financial Analysts: Streamline valuation processes with ready-to-use financial models tailored for Accel Entertainment, Inc. (ACEL).
- Consultants: Deliver professional valuation insights on Accel Entertainment, Inc. (ACEL) to clients quickly and accurately.
- Business Owners: Understand how companies like Accel Entertainment, Inc. (ACEL) are valued to guide your own business strategy.
- Finance Students: Learn valuation techniques using real-world data and scenarios related to Accel Entertainment, Inc. (ACEL).
What the Template Contains
- Preloaded ACEL Data: Historical and projected financial data, including revenue, EBIT, and capital expenditures.
- DCF and WACC Models: Professional-grade sheets for calculating intrinsic value and Weighted Average Cost of Capital.
- Editable Inputs: Yellow-highlighted cells for adjusting revenue growth, tax rates, and discount rates.
- Financial Statements: Comprehensive annual and quarterly financials for deeper analysis.
- Key Ratios: Profitability, leverage, and efficiency ratios to evaluate performance.
- Dashboard and Charts: Visual summaries of valuation outcomes and assumptions.
Disclaimer
All information, articles, and product details provided on this website are for general informational and educational purposes only. We do not claim any ownership over, nor do we intend to infringe upon, any trademarks, copyrights, logos, brand names, or other intellectual property mentioned or depicted on this site. Such intellectual property remains the property of its respective owners, and any references here are made solely for identification or informational purposes, without implying any affiliation, endorsement, or partnership.
We make no representations or warranties, express or implied, regarding the accuracy, completeness, or suitability of any content or products presented. Nothing on this website should be construed as legal, tax, investment, financial, medical, or other professional advice. In addition, no part of this site—including articles or product references—constitutes a solicitation, recommendation, endorsement, advertisement, or offer to buy or sell any securities, franchises, or other financial instruments, particularly in jurisdictions where such activity would be unlawful.
All content is of a general nature and may not address the specific circumstances of any individual or entity. It is not a substitute for professional advice or services. Any actions you take based on the information provided here are strictly at your own risk. You accept full responsibility for any decisions or outcomes arising from your use of this website and agree to release us from any liability in connection with your use of, or reliance upon, the content or products found herein.