
|
Acres Commercial Realty Corp. (ACR) DCF تقييم |
Fully Editable: Tailor To Your Needs In Excel Or Sheets
Professional Design: Trusted, Industry-Standard Templates
Investor-Approved Valuation Models
MAC/PC Compatible, Fully Unlocked
No Expertise Is Needed; Easy To Follow
ACRES Commercial Realty Corp. (ACR) Bundle
استكشف الآفاق المالية لشركة ACRES Commercial Realty Corp. (ACR) باستخدام حاسبة DCF سهلة الاستخدام! أدخل افتراضات النمو والهوامش والتكلفة الخاصة بك لحساب القيمة الجوهرية لشركة ACRES Commercial Realty Corp. (ACR) وصقل إستراتيجيتك الاستثمارية.
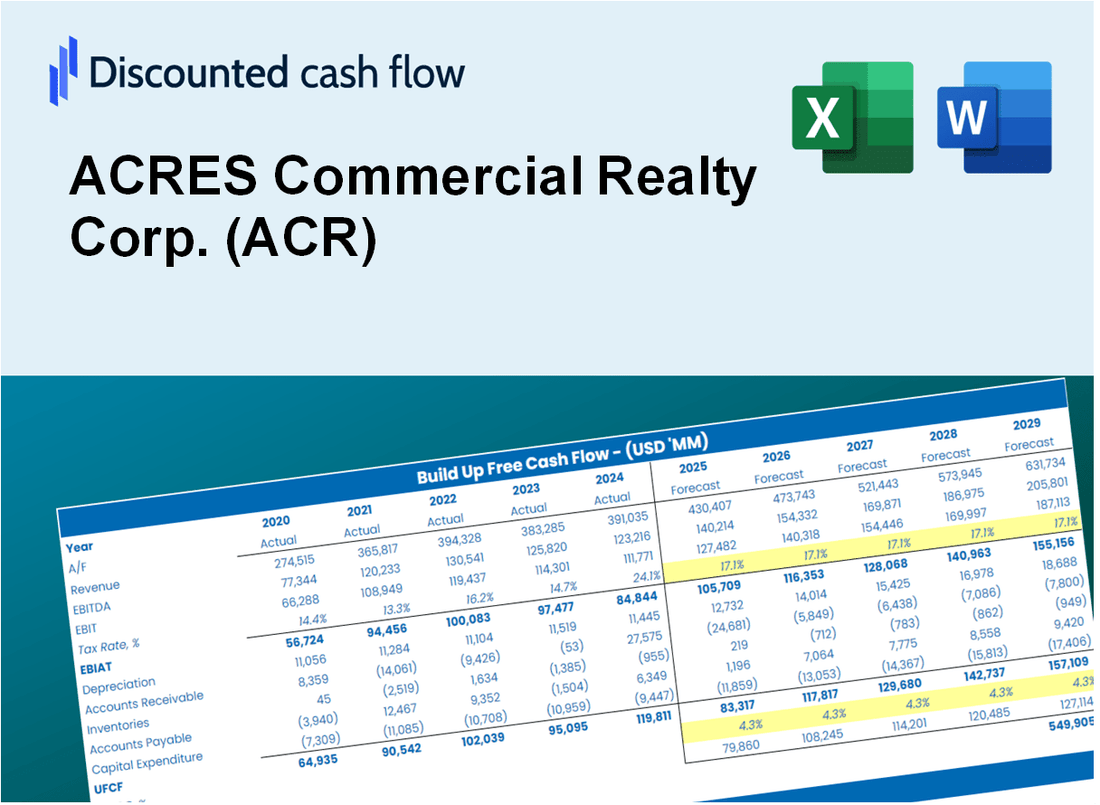
Discounted Cash Flow (DCF) - (USD MM)
| Year | AY1 2020 |
AY2 2021 |
AY3 2022 |
AY4 2023 |
AY5 2024 |
FY1 2025 |
FY2 2026 |
FY3 2027 |
FY4 2028 |
FY5 2029 |
|---|---|---|---|---|---|---|---|---|---|---|
| Revenue | -80.9 | 106.4 | 62.9 | 91.1 | 83.5 | 61.7 | 45.6 | 33.7 | 24.9 | 18.4 |
| Revenue Growth, % | 0 | -231.63 | -40.93 | 44.94 | -8.39 | -26.09 | -26.09 | -26.09 | -26.09 | -26.09 |
| EBITDA | -143.3 | 101.9 | 88.4 | 150.0 | 126.2 | 61.2 | 45.2 | 33.4 | 24.7 | 18.3 |
| EBITDA, % | 177.18 | 95.76 | 140.66 | 164.56 | 151.1 | 99.15 | 99.15 | 99.15 | 99.15 | 99.15 |
| Depreciation | .0 | .1 | .1 | .1 | .1 | .0 | .0 | .0 | .0 | .0 |
| Depreciation, % | -0.06059857 | 0.08831764 | 0.13519 | 0.09985625 | 0.06827328 | 0.0662075 | 0.0662075 | 0.0662075 | 0.0662075 | 0.0662075 |
| EBIT | -143.3 | 101.8 | 88.4 | 149.9 | 126.1 | 61.2 | 45.2 | 33.4 | 24.7 | 18.3 |
| EBIT, % | 177.24 | 95.68 | 140.52 | 164.46 | 151.03 | 99.14 | 99.14 | 99.14 | 99.14 | 99.14 |
| Total Cash | 31.4 | 35.5 | 66.2 | 83.4 | 56.7 | 31.3 | 23.2 | 17.1 | 12.7 | 9.4 |
| Total Cash, percent | .0 | .0 | .0 | .0 | .0 | .0 | .0 | .0 | .0 | .0 |
| Account Receivables | 14.9 | 24.7 | 13.3 | 12.6 | 16.9 | 7.4 | 5.5 | 4.0 | 3.0 | 2.2 |
| Account Receivables, % | -18.37 | 23.21 | 21.12 | 13.78 | 20.29 | 12.01 | 12.01 | 12.01 | 12.01 | 12.01 |
| Inventories | .0 | .0 | .0 | .0 | .0 | .0 | .0 | .0 | .0 | .0 |
| Inventories, % | 0 | 0 | 0 | 0 | 0 | 0 | 0 | 0 | 0 | 0 |
| Accounts Payable | 6.0 | 5.9 | 6.9 | 8.5 | 7.0 | 3.3 | 2.4 | 1.8 | 1.3 | 1.0 |
| Accounts Payable, % | -7.46 | 5.58 | 11.01 | 9.28 | 8.33 | 5.35 | 5.35 | 5.35 | 5.35 | 5.35 |
| Capital Expenditure | .0 | -.1 | -.7 | .0 | .0 | -.2 | -.1 | -.1 | -.1 | .0 |
| Capital Expenditure, % | 0.00618353 | -0.05731251 | -1.18 | 0 | -0.00958222 | -0.24908 | -0.24908 | -0.24908 | -0.24908 | -0.24908 |
| Tax Rate, % | -1.55 | -1.55 | -1.55 | -1.55 | -1.55 | -1.55 | -1.55 | -1.55 | -1.55 | -1.55 |
| EBITAT | -143.3 | 101.8 | 87.2 | 152.9 | 128.0 | 61.0 | 45.1 | 33.3 | 24.6 | 18.2 |
| Depreciation | ||||||||||
| Changes in Account Receivables | ||||||||||
| Changes in Inventories | ||||||||||
| Changes in Accounts Payable | ||||||||||
| Capital Expenditure | ||||||||||
| UFCF | -152.1 | 91.9 | 99.0 | 155.3 | 122.2 | 66.8 | 46.1 | 34.1 | 25.2 | 18.6 |
| WACC, % | 8.39 | 8.39 | 8.3 | 8.39 | 8.39 | 8.37 | 8.37 | 8.37 | 8.37 | 8.37 |
| PV UFCF | ||||||||||
| SUM PV UFCF | 158.3 | |||||||||
| Long Term Growth Rate, % | 2.00 | |||||||||
| Free cash flow (T + 1) | 19 | |||||||||
| Terminal Value | 298 | |||||||||
| Present Terminal Value | 199 | |||||||||
| Enterprise Value | 357 | |||||||||
| Net Debt | 1,349 | |||||||||
| Equity Value | -991 | |||||||||
| Diluted Shares Outstanding, MM | 8 | |||||||||
| Equity Value Per Share | -125.10 |
What You Will Get
- Real ACR Financial Data: Pre-filled with ACRES Commercial Realty Corp.'s historical and projected data for precise analysis.
- Fully Editable Template: Easily modify key inputs such as revenue growth, WACC, and EBITDA %.
- Automatic Calculations: Instantly see ACR's intrinsic value update based on your adjustments.
- Professional Valuation Tool: Tailored for investors, analysts, and consultants seeking accurate DCF results.
- User-Friendly Design: Intuitive structure and clear instructions suitable for all experience levels.
Key Features
- 🔍 Real-Life ACR Financials: Pre-filled historical and projected data for ACRES Commercial Realty Corp. (ACR).
- ✏️ Fully Customizable Inputs: Adjust all critical parameters (yellow cells) like WACC, growth %, and tax rates.
- 📊 Professional DCF Valuation: Built-in formulas calculate ACRES’ intrinsic value using the Discounted Cash Flow method.
- ⚡ Instant Results: Visualize ACRES’ valuation instantly after making changes.
- Scenario Analysis: Test and compare outcomes for various financial assumptions side-by-side.
How It Works
- 1. Open the Template: Download and open the Excel file containing ACRES Commercial Realty Corp.'s (ACR) financial data.
- 2. Edit Assumptions: Modify key inputs such as occupancy rates, revenue growth, and operating expenses.
- 3. View Results Instantly: The DCF model automatically calculates the intrinsic value and NPV for ACRES Commercial Realty Corp. (ACR).
- 4. Test Scenarios: Analyze various forecasts to evaluate different valuation scenarios for ACRES Commercial Realty Corp. (ACR).
- 5. Use with Confidence: Share professional valuation insights to enhance your investment decisions regarding ACRES Commercial Realty Corp. (ACR).
Why Choose ACRES Commercial Realty Corp. (ACR) Calculator?
- Accuracy: Utilizes real ACRES financial data for precise calculations.
- Flexibility: Allows users to easily adjust and experiment with various inputs.
- Time-Saving: Eliminate the need to create a DCF model from the ground up.
- Professional-Grade: Crafted with the expertise and usability that CFOs demand.
- User-Friendly: Intuitive interface suitable for users without extensive financial modeling skills.
Who Should Use This Product?
- Investors: Evaluate ACRES Commercial Realty Corp.'s (ACR) performance before making investment decisions.
- CFOs and Financial Analysts: Optimize valuation methodologies and assess financial forecasts for ACRES Commercial Realty Corp. (ACR).
- Real Estate Developers: Understand how commercial real estate companies like ACRES Commercial Realty Corp. (ACR) are valued.
- Consultants: Provide detailed valuation analyses and reports for clients interested in ACRES Commercial Realty Corp. (ACR).
- Students and Educators: Utilize industry-specific data to practice and teach valuation principles related to ACRES Commercial Realty Corp. (ACR).
What the Template Contains
- Preloaded ACR Data: Historical and projected financial data, including revenue, EBIT, and capital expenditures.
- DCF and WACC Models: Professional-grade sheets for calculating intrinsic value and Weighted Average Cost of Capital.
- Editable Inputs: Yellow-highlighted cells for adjusting revenue growth, tax rates, and discount rates.
- Financial Statements: Comprehensive annual and quarterly financials for deeper analysis.
- Key Ratios: Profitability, leverage, and efficiency ratios to evaluate performance.
- Dashboard and Charts: Visual summaries of valuation outcomes and assumptions.
Disclaimer
All information, articles, and product details provided on this website are for general informational and educational purposes only. We do not claim any ownership over, nor do we intend to infringe upon, any trademarks, copyrights, logos, brand names, or other intellectual property mentioned or depicted on this site. Such intellectual property remains the property of its respective owners, and any references here are made solely for identification or informational purposes, without implying any affiliation, endorsement, or partnership.
We make no representations or warranties, express or implied, regarding the accuracy, completeness, or suitability of any content or products presented. Nothing on this website should be construed as legal, tax, investment, financial, medical, or other professional advice. In addition, no part of this site—including articles or product references—constitutes a solicitation, recommendation, endorsement, advertisement, or offer to buy or sell any securities, franchises, or other financial instruments, particularly in jurisdictions where such activity would be unlawful.
All content is of a general nature and may not address the specific circumstances of any individual or entity. It is not a substitute for professional advice or services. Any actions you take based on the information provided here are strictly at your own risk. You accept full responsibility for any decisions or outcomes arising from your use of this website and agree to release us from any liability in connection with your use of, or reliance upon, the content or products found herein.