
|
Aeva Technologies ، Inc. (AEVA) DCF تقييم |
Fully Editable: Tailor To Your Needs In Excel Or Sheets
Professional Design: Trusted, Industry-Standard Templates
Investor-Approved Valuation Models
MAC/PC Compatible, Fully Unlocked
No Expertise Is Needed; Easy To Follow
Aeva Technologies, Inc. (AEVA) Bundle
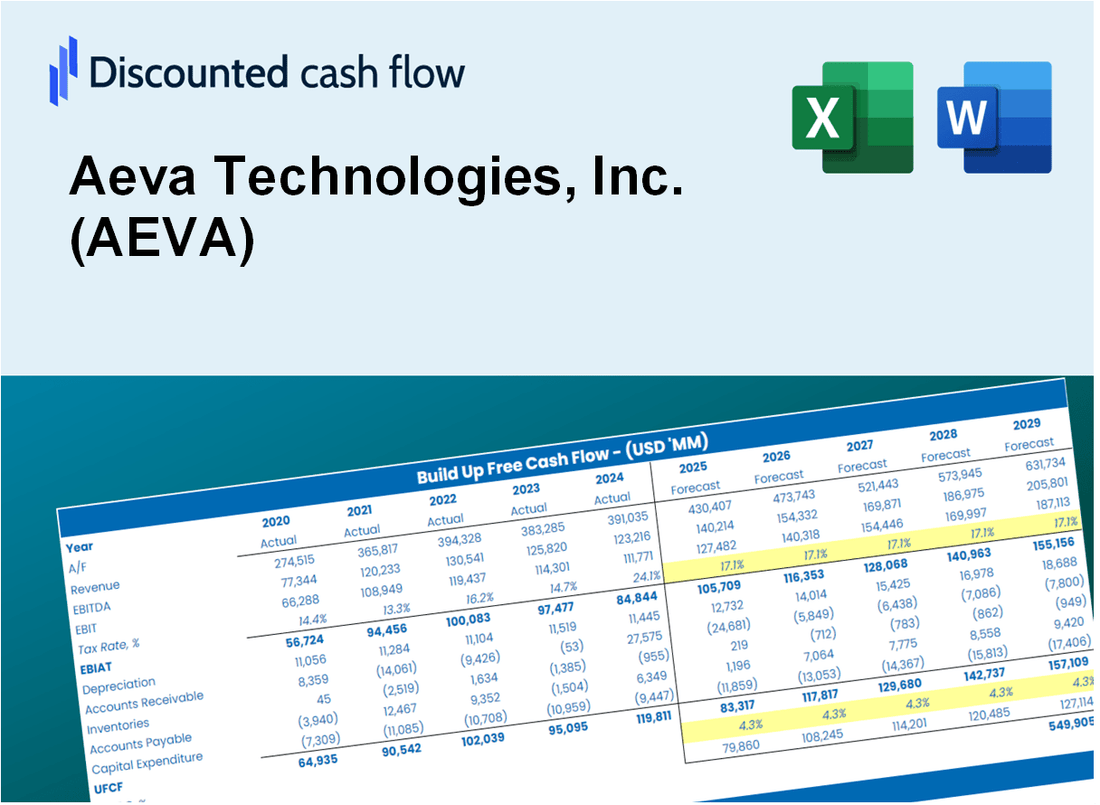
تم تصميم Aeva Technologies، Inc. من أجل الدقة (AEVA) تمكنك حاسبة DCF من تقييم تقييم Aeva Technologies باستخدام البيانات المالية في الوقت الفعلي، مما يوفر مرونة كاملة لتعديل جميع المعايير الأساسية لتحسين التوقعات.
Discounted Cash Flow (DCF) - (USD MM)
| Year | AY1 2020 |
AY2 2021 |
AY3 2022 |
AY4 2023 |
AY5 2024 |
FY1 2025 |
FY2 2026 |
FY3 2027 |
FY4 2028 |
FY5 2029 |
|---|---|---|---|---|---|---|---|---|---|---|
| Revenue | 4.8 | 9.3 | 4.2 | 4.3 | 9.1 | 12.2 | 16.5 | 22.2 | 30.0 | 40.4 |
| Revenue Growth, % | 0 | 91.31 | -54.75 | 2.86 | 110.23 | 34.85 | 34.85 | 34.85 | 34.85 | 34.85 |
| EBITDA | -24.9 | -101.1 | -145.8 | -140.1 | -137.9 | -12.2 | -16.5 | -22.2 | -30.0 | -40.4 |
| EBITDA, % | -515.03 | -1091.04 | -3478.24 | -3248.61 | -1521.56 | -100 | -100 | -100 | -100 | -100 |
| Depreciation | .8 | 3.1 | 6.1 | 7.7 | 8.9 | 8.5 | 11.5 | 15.5 | 20.9 | 28.2 |
| Depreciation, % | 16.48 | 33.47 | 146.64 | 178.76 | 98.65 | 69.72 | 69.72 | 69.72 | 69.72 | 69.72 |
| EBIT | -25.7 | -104.2 | -152.0 | -147.8 | -146.9 | -12.2 | -16.5 | -22.2 | -30.0 | -40.4 |
| EBIT, % | -531.51 | -1124.51 | -3624.88 | -3427.37 | -1620.21 | -100 | -100 | -100 | -100 | -100 |
| Total Cash | 24.6 | 445.0 | 323.8 | 221.0 | 112.0 | 12.2 | 16.5 | 22.2 | 30.0 | 40.4 |
| Total Cash, percent | .0 | .0 | .0 | .0 | .0 | .0 | .0 | .0 | .0 | .0 |
| Account Receivables | .8 | 6.4 | 3.1 | .8 | 1.3 | 4.7 | 6.3 | 8.5 | 11.5 | 15.5 |
| Account Receivables, % | 15.84 | 69.19 | 74.76 | 17.81 | 14.03 | 38.33 | 38.33 | 38.33 | 38.33 | 38.33 |
| Inventories | 1.2 | 2.1 | 3.0 | 2.4 | 2.3 | 4.9 | 6.6 | 8.8 | 11.9 | 16.1 |
| Inventories, % | 25.17 | 22.27 | 70.4 | 55.06 | 25.87 | 39.75 | 39.75 | 39.75 | 39.75 | 39.75 |
| Accounts Payable | 2.1 | 4.4 | 5.2 | 3.6 | 5.5 | 8.2 | 11.0 | 14.8 | 20.0 | 27.0 |
| Accounts Payable, % | 42.76 | 47.34 | 123.62 | 83.53 | 60.15 | 66.76 | 66.76 | 66.76 | 66.76 | 66.76 |
| Capital Expenditure | -.9 | -8.4 | -7.4 | -6.1 | -5.1 | -8.9 | -12.0 | -16.2 | -21.8 | -29.4 |
| Capital Expenditure, % | -17.65 | -90.12 | -177.46 | -141.56 | -56.34 | -72.82 | -72.82 | -72.82 | -72.82 | -72.82 |
| Tax Rate, % | -0.11243 | -0.11243 | -0.11243 | -0.11243 | -0.11243 | -0.11243 | -0.11243 | -0.11243 | -0.11243 | -0.11243 |
| EBITAT | -25.7 | -103.8 | -152.0 | -147.8 | -147.0 | -12.2 | -16.5 | -22.2 | -30.0 | -40.4 |
| Depreciation | ||||||||||
| Changes in Account Receivables | ||||||||||
| Changes in Inventories | ||||||||||
| Changes in Accounts Payable | ||||||||||
| Capital Expenditure | ||||||||||
| UFCF | -25.7 | -113.2 | -150.1 | -144.8 | -141.8 | -15.8 | -17.5 | -23.6 | -31.8 | -42.8 |
| WACC, % | 13.71 | 13.71 | 13.71 | 13.71 | 13.71 | 13.71 | 13.71 | 13.71 | 13.71 | 13.71 |
| PV UFCF | ||||||||||
| SUM PV UFCF | -85.0 | |||||||||
| Long Term Growth Rate, % | 2.00 | |||||||||
| Free cash flow (T + 1) | -44 | |||||||||
| Terminal Value | -373 | |||||||||
| Present Terminal Value | -196 | |||||||||
| Enterprise Value | -281 | |||||||||
| Net Debt | -25 | |||||||||
| Equity Value | -256 | |||||||||
| Diluted Shares Outstanding, MM | 53 | |||||||||
| Equity Value Per Share | -4.80 |
What You Will Get
- Real Aeva Data: Preloaded financials – from revenue to EBIT – based on actual and projected figures for Aeva Technologies, Inc. (AEVA).
- Full Customization: Adjust all critical parameters (yellow cells) like WACC, growth %, and tax rates to fit your analysis.
- Instant Valuation Updates: Automatic recalculations to analyze the impact of changes on Aeva’s fair value.
- Versatile Excel Template: Tailored for quick edits, scenario testing, and detailed projections specific to Aeva Technologies, Inc. (AEVA).
- Time-Saving and Accurate: Skip building models from scratch while maintaining precision and flexibility in your financial assessments.
Key Features
- Accurate Aeva Financials: Gain access to reliable pre-loaded historical data and future forecasts.
- Customizable Forecast Inputs: Modify highlighted cells for metrics such as WACC, growth rates, and profit margins.
- Real-Time Calculations: Automatic updates for DCF, Net Present Value (NPV), and cash flow analyses.
- Interactive Dashboard: User-friendly charts and summaries to help visualize your valuation outcomes.
- Designed for All Levels: An intuitive layout tailored for investors, CFOs, and consultants alike.
How It Works
- Step 1: Download the prebuilt Excel template featuring Aeva Technologies, Inc. (AEVA) data.
- Step 2: Navigate through the pre-filled sheets to familiarize yourself with the essential metrics.
- Step 3: Modify forecasts and assumptions in the editable yellow cells (WACC, growth, margins).
- Step 4: Instantly view updated results, including Aeva Technologies, Inc. (AEVA)'s intrinsic value.
- Step 5: Utilize the outputs to make informed investment decisions or create reports.
Why Choose This Calculator for Aeva Technologies, Inc. (AEVA)?
- Designed for Experts: A sophisticated tool tailored for analysts, CFOs, and industry consultants.
- Accurate Financial Data: Aeva’s historical and forecasted financials are preloaded for precision.
- Flexible Scenario Analysis: Effortlessly simulate various forecasts and assumptions.
- Insightful Outputs: Automatically computes intrinsic value, NPV, and essential metrics.
- User-Friendly: Comprehensive step-by-step guidance simplifies the process.
Who Should Use Aeva Technologies, Inc. (AEVA)?
- Engineering Students: Explore cutting-edge sensor technology and its applications in real-world scenarios.
- Researchers: Integrate advanced lidar models into academic projects or studies.
- Investors: Evaluate your investment strategies and assess the market potential of Aeva's innovations.
- Tech Analysts: Enhance your analysis with a customizable model for evaluating Aeva's financial performance.
- Entrepreneurs: Understand how emerging tech companies like Aeva are positioned in the market.
What the Template Contains
- Historical Data: Includes Aeva Technologies’ past financials and baseline forecasts.
- DCF and Levered DCF Models: Detailed templates to calculate Aeva Technologies’ intrinsic value.
- WACC Sheet: Pre-built calculations for Weighted Average Cost of Capital.
- Editable Inputs: Modify key drivers like growth rates, EBITDA %, and CAPEX assumptions.
- Quarterly and Annual Statements: A complete breakdown of Aeva Technologies’ financials.
- Interactive Dashboard: Visualize valuation results and projections dynamically.
Disclaimer
All information, articles, and product details provided on this website are for general informational and educational purposes only. We do not claim any ownership over, nor do we intend to infringe upon, any trademarks, copyrights, logos, brand names, or other intellectual property mentioned or depicted on this site. Such intellectual property remains the property of its respective owners, and any references here are made solely for identification or informational purposes, without implying any affiliation, endorsement, or partnership.
We make no representations or warranties, express or implied, regarding the accuracy, completeness, or suitability of any content or products presented. Nothing on this website should be construed as legal, tax, investment, financial, medical, or other professional advice. In addition, no part of this site—including articles or product references—constitutes a solicitation, recommendation, endorsement, advertisement, or offer to buy or sell any securities, franchises, or other financial instruments, particularly in jurisdictions where such activity would be unlawful.
All content is of a general nature and may not address the specific circumstances of any individual or entity. It is not a substitute for professional advice or services. Any actions you take based on the information provided here are strictly at your own risk. You accept full responsibility for any decisions or outcomes arising from your use of this website and agree to release us from any liability in connection with your use of, or reliance upon, the content or products found herein.