
|
Agriforce Growing Systems Ltd. (AGRI) DCF تقييم |
Fully Editable: Tailor To Your Needs In Excel Or Sheets
Professional Design: Trusted, Industry-Standard Templates
Investor-Approved Valuation Models
MAC/PC Compatible, Fully Unlocked
No Expertise Is Needed; Easy To Follow
AgriFORCE Growing Systems Ltd. (AGRI) Bundle
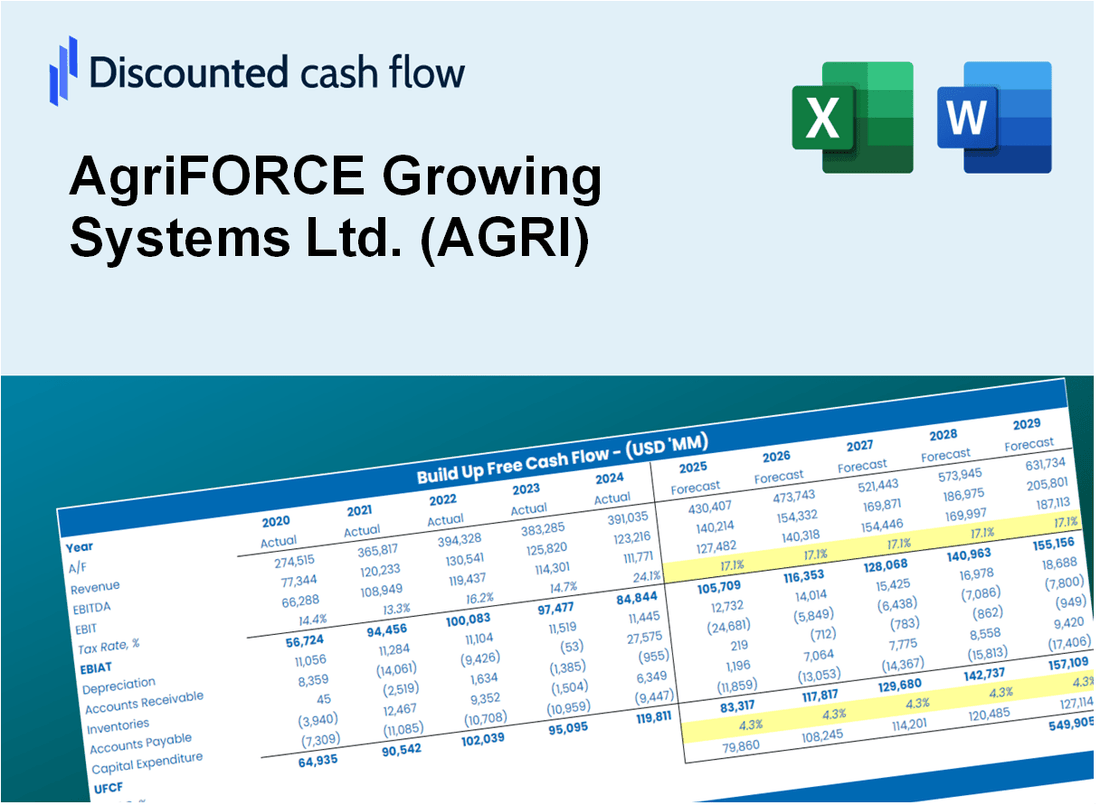
تبحث لتقييم Agriforce Growing Systems Ltd. القيمة الجوهرية؟ يدمج حاسبة Agri DCF الخاصة بنا البيانات الواقعية مع ميزات تخصيص واسعة ، مما يتيح لك ضبط التنبؤات وتعزيز استراتيجيات الاستثمار الخاصة بك.
Discounted Cash Flow (DCF) - (USD MM)
| Year | AY1 2020 |
AY2 2021 |
AY3 2022 |
AY4 2023 |
AY5 2024 |
FY1 2025 |
FY2 2026 |
FY3 2027 |
FY4 2028 |
FY5 2029 |
|---|---|---|---|---|---|---|---|---|---|---|
| Revenue | .0 | .0 | .0 | .0 | .1 | .1 | .1 | .1 | .2 | .2 |
| Revenue Growth, % | 0 | 0 | 0 | 0 | 316.97 | 25 | 25 | 25 | 25 | 25 |
| EBITDA | -3.3 | -6.1 | -12.5 | -3.1 | -12.6 | .0 | .0 | .0 | .0 | .0 |
| EBITDA, % | 100 | 100 | 100 | -18979.61 | -18603.01 | 20 | 20 | 20 | 20 | 20 |
| Depreciation | .0 | .0 | .0 | .7 | .7 | .1 | .1 | .1 | .2 | .2 |
| Depreciation, % | 100 | 100 | 100 | 4175.69 | 982.6 | 100 | 100 | 100 | 100 | 100 |
| EBIT | -3.3 | -6.2 | -12.5 | -3.8 | -13.3 | .0 | .0 | .0 | .0 | .0 |
| EBIT, % | 100 | 100 | 100 | -23155.3 | -19585.62 | 20 | 20 | 20 | 20 | 20 |
| Total Cash | .7 | 7.8 | 2.3 | 3.9 | .5 | .1 | .1 | .1 | .2 | .2 |
| Total Cash, percent | .0 | .0 | .0 | .0 | .0 | .0 | .0 | .0 | .0 | .0 |
| Account Receivables | .0 | .0 | .0 | .0 | .2 | .1 | .1 | .1 | .2 | .2 |
| Account Receivables, % | 100 | 100 | 100 | 189.54 | 278.95 | 100 | 100 | 100 | 100 | 100 |
| Inventories | .2 | .2 | .5 | .0 | .3 | .1 | .1 | .1 | .2 | .2 |
| Inventories, % | 100 | 100 | 100 | 238.66 | 397.03 | 100 | 100 | 100 | 100 | 100 |
| Accounts Payable | 1.0 | .6 | .5 | .6 | .7 | .1 | .1 | .1 | .2 | .2 |
| Accounts Payable, % | 100 | 100 | 100 | 3550.94 | 1025.48 | 100 | 100 | 100 | 100 | 100 |
| Capital Expenditure | -.2 | -1.0 | -.7 | .0 | -1.5 | .0 | .0 | .0 | .0 | .0 |
| Capital Expenditure, % | 100 | 100 | 100 | 0 | -2229.74 | -20 | -20 | -20 | -20 | -20 |
| Tax Rate, % | 0 | 0 | 0 | 0 | 0 | 0 | 0 | 0 | 0 | 0 |
| EBITAT | -3.3 | -6.2 | -12.5 | -3.8 | -13.3 | .0 | .0 | .0 | .0 | .0 |
| Depreciation | ||||||||||
| Changes in Account Receivables | ||||||||||
| Changes in Inventories | ||||||||||
| Changes in Accounts Payable | ||||||||||
| Capital Expenditure | ||||||||||
| UFCF | -2.7 | -7.7 | -13.5 | -2.5 | -14.4 | -.2 | .1 | .1 | .1 | .2 |
| WACC, % | 124.21 | 124.21 | 124.21 | 124.21 | 124.21 | 124.21 | 124.21 | 124.21 | 124.21 | 124.21 |
| PV UFCF | ||||||||||
| SUM PV UFCF | -.1 | |||||||||
| Long Term Growth Rate, % | 2.00 | |||||||||
| Free cash flow (T + 1) | 0 | |||||||||
| Terminal Value | 0 | |||||||||
| Present Terminal Value | 0 | |||||||||
| Enterprise Value | 0 | |||||||||
| Net Debt | 1 | |||||||||
| Equity Value | -1 | |||||||||
| Diluted Shares Outstanding, MM | 0 | |||||||||
| Equity Value Per Share | -2.61 |
What You Will Get
- Real AgriFORCE Data: Preloaded financials – from revenue to EBIT – based on actual and projected figures for AgriFORCE Growing Systems Ltd. (AGRI).
- Full Customization: Adjust all critical parameters (yellow cells) such as WACC, growth %, and tax rates to fit your analysis.
- Instant Valuation Updates: Automatic recalculations to evaluate the impact of changes on AgriFORCE's fair value.
- Versatile Excel Template: Designed for quick edits, scenario testing, and comprehensive projections tailored to AgriFORCE (AGRI).
- Time-Saving and Accurate: Avoid building models from the ground up while ensuring precision and flexibility in your assessments.
Key Features
- Customizable Growth Inputs: Adjust essential parameters such as crop yield projections, operational costs, and capital investments.
- Instant DCF Valuation: Automatically computes intrinsic value, NPV, and other financial metrics in real-time.
- High Precision Analytics: Leverages AgriFORCE's real-world agricultural data for accurate valuation results.
- Simplified Scenario Testing: Easily evaluate various agricultural strategies and their potential impacts.
- Efficiency Booster: Streamline the valuation process without the need for intricate model development.
How It Works
- Download: Obtain the pre-configured Excel file featuring AgriFORCE Growing Systems Ltd.'s (AGRI) financial data.
- Customize: Modify projections, such as revenue growth, EBITDA %, and WACC to suit your analysis.
- Update Automatically: The intrinsic value and NPV calculations refresh in real-time as you make changes.
- Test Scenarios: Generate various forecasts and evaluate results immediately.
- Make Decisions: Leverage the valuation insights to inform your investment choices.
Why Choose AgriFORCE Growing Systems Ltd. (AGRI)?
- Innovation: Cutting-edge agricultural technology for enhanced productivity.
- Sustainability: Committed to environmentally friendly farming practices.
- Efficiency: Solutions designed to optimize resource use and reduce waste.
- Expertise: Backed by a team of industry professionals with extensive knowledge.
- User-Centric: Tailored solutions that cater to the unique needs of farmers and growers.
Who Should Use This Product?
- Agricultural Investors: Make informed decisions about investing in AgriFORCE Growing Systems Ltd. (AGRI).
- Agronomy Analysts: Enhance research efforts with comprehensive data and analysis tools.
- Consultants: Provide clients with expert insights on agricultural innovations and market trends.
- Farm Owners: Gain a deeper understanding of how companies like AgriFORCE are transforming agricultural practices.
- Students in Agriculture: Explore industry-specific insights and methodologies using real-world examples.
What the Template Contains
- Pre-Filled DCF Model: AgriFORCE Growing Systems Ltd.'s (AGRI) financial data preloaded for immediate use.
- WACC Calculator: Detailed calculations for Weighted Average Cost of Capital.
- Financial Ratios: Evaluate AgriFORCE's (AGRI) profitability, leverage, and efficiency.
- Editable Inputs: Change assumptions such as growth, margins, and CAPEX to fit your scenarios.
- Financial Statements: Annual and quarterly reports to support detailed analysis.
- Interactive Dashboard: Easily visualize key valuation metrics and results.
Disclaimer
All information, articles, and product details provided on this website are for general informational and educational purposes only. We do not claim any ownership over, nor do we intend to infringe upon, any trademarks, copyrights, logos, brand names, or other intellectual property mentioned or depicted on this site. Such intellectual property remains the property of its respective owners, and any references here are made solely for identification or informational purposes, without implying any affiliation, endorsement, or partnership.
We make no representations or warranties, express or implied, regarding the accuracy, completeness, or suitability of any content or products presented. Nothing on this website should be construed as legal, tax, investment, financial, medical, or other professional advice. In addition, no part of this site—including articles or product references—constitutes a solicitation, recommendation, endorsement, advertisement, or offer to buy or sell any securities, franchises, or other financial instruments, particularly in jurisdictions where such activity would be unlawful.
All content is of a general nature and may not address the specific circumstances of any individual or entity. It is not a substitute for professional advice or services. Any actions you take based on the information provided here are strictly at your own risk. You accept full responsibility for any decisions or outcomes arising from your use of this website and agree to release us from any liability in connection with your use of, or reliance upon, the content or products found herein.