
|
Akzo Nobel India Limited (Akzoindia.ns) تقييم DCF |
Fully Editable: Tailor To Your Needs In Excel Or Sheets
Professional Design: Trusted, Industry-Standard Templates
Investor-Approved Valuation Models
MAC/PC Compatible, Fully Unlocked
No Expertise Is Needed; Easy To Follow
Akzo Nobel India Limited (AKZOINDIA.NS) Bundle
سواء كنت مستثمرًا أو محللًا ، فإن حاسبة DCF (Akzoindians) هذه هي مورد الخاص بك للتقييم الدقيق. محملة ببيانات حقيقية من Akzo Nobel India Limited ، يمكنك ضبط التوقعات ومراقبة التأثيرات في الوقت الفعلي.
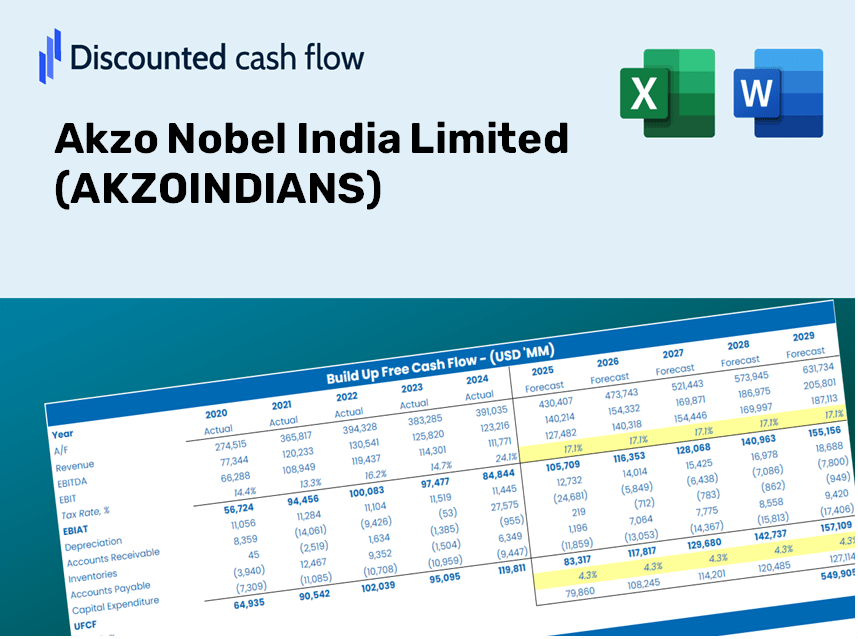
Discounted Cash Flow (DCF) - (USD MM)
| Year | AY1 2021 |
AY2 2022 |
AY3 2023 |
AY4 2024 |
AY5 2025 |
FY1 2026 |
FY2 2027 |
FY3 2028 |
FY4 2029 |
FY5 2030 |
|---|---|---|---|---|---|---|---|---|---|---|
| Revenue | 23,971.0 | 31,087.0 | 37,768.0 | 39,367.0 | 40,912.0 | 46,980.8 | 53,949.9 | 61,952.8 | 71,142.8 | 81,696.0 |
| Revenue Growth, % | 0 | 29.69 | 21.49 | 4.23 | 3.92 | 14.83 | 14.83 | 14.83 | 14.83 | 14.83 |
| EBITDA | 3,640.0 | 4,545.0 | 5,516.0 | 6,673.0 | 6,415.0 | 7,238.9 | 8,312.7 | 9,545.8 | 10,961.8 | 12,587.9 |
| EBITDA, % | 15.19 | 14.62 | 14.6 | 16.95 | 15.68 | 15.41 | 15.41 | 15.41 | 15.41 | 15.41 |
| Depreciation | 755.0 | 759.0 | 825.0 | 823.0 | 894.0 | 1,132.4 | 1,300.3 | 1,493.2 | 1,714.7 | 1,969.1 |
| Depreciation, % | 3.15 | 2.44 | 2.18 | 2.09 | 2.19 | 2.41 | 2.41 | 2.41 | 2.41 | 2.41 |
| EBIT | 2,885.0 | 3,786.0 | 4,691.0 | 5,850.0 | 5,521.0 | 6,106.5 | 7,012.4 | 8,052.6 | 9,247.1 | 10,618.8 |
| EBIT, % | 12.04 | 12.18 | 12.42 | 14.86 | 13.49 | 13 | 13 | 13 | 13 | 13 |
| Total Cash | 7,192.0 | 4,471.0 | 5,526.0 | 5,142.0 | 2,868.0 | 7,431.3 | 8,533.6 | 9,799.5 | 11,253.1 | 12,922.4 |
| Total Cash, percent | .0 | .0 | .0 | .0 | .0 | .0 | .0 | .0 | .0 | .0 |
| Account Receivables | 4,131.0 | 4,955.0 | 5,980.0 | 6,374.0 | 5,849.0 | 7,469.4 | 8,577.4 | 9,849.7 | 11,310.8 | 12,988.6 |
| Account Receivables, % | 17.23 | 15.94 | 15.83 | 16.19 | 14.3 | 15.9 | 15.9 | 15.9 | 15.9 | 15.9 |
| Inventories | 4,882.0 | 6,644.0 | 5,979.0 | 6,115.0 | 6,047.0 | 8,257.7 | 9,482.6 | 10,889.2 | 12,504.5 | 14,359.4 |
| Inventories, % | 20.37 | 21.37 | 15.83 | 15.53 | 14.78 | 17.58 | 17.58 | 17.58 | 17.58 | 17.58 |
| Accounts Payable | 7,984.0 | 8,635.0 | 8,634.0 | 9,975.0 | 9,563.0 | 12,464.7 | 14,313.7 | 16,437.0 | 18,875.2 | 21,675.2 |
| Accounts Payable, % | 33.31 | 27.78 | 22.86 | 25.34 | 23.37 | 26.53 | 26.53 | 26.53 | 26.53 | 26.53 |
| Capital Expenditure | -281.0 | -634.0 | -1,043.0 | -1,185.0 | -1,065.0 | -1,088.7 | -1,250.2 | -1,435.6 | -1,648.6 | -1,893.2 |
| Capital Expenditure, % | -1.17 | -2.04 | -2.76 | -3.01 | -2.6 | -2.32 | -2.32 | -2.32 | -2.32 | -2.32 |
| Tax Rate, % | 24.64 | 24.64 | 24.64 | 24.64 | 24.64 | 24.64 | 24.64 | 24.64 | 24.64 | 24.64 |
| EBITAT | 2,152.9 | 2,994.3 | 3,448.0 | 4,355.3 | 4,160.9 | 4,604.7 | 5,287.7 | 6,072.1 | 6,972.8 | 8,007.2 |
| Depreciation | ||||||||||
| Changes in Account Receivables | ||||||||||
| Changes in Inventories | ||||||||||
| Changes in Accounts Payable | ||||||||||
| Capital Expenditure | ||||||||||
| UFCF | 1,597.9 | 1,184.3 | 2,869.0 | 4,804.3 | 4,170.9 | 3,719.1 | 4,854.0 | 5,574.0 | 6,400.8 | 7,350.3 |
| WACC, % | 4.77 | 4.78 | 4.77 | 4.77 | 4.77 | 4.77 | 4.77 | 4.77 | 4.77 | 4.77 |
| PV UFCF | ||||||||||
| SUM PV UFCF | 23,950.2 | |||||||||
| Long Term Growth Rate, % | 3.50 | |||||||||
| Free cash flow (T + 1) | 7,608 | |||||||||
| Terminal Value | 596,882 | |||||||||
| Present Terminal Value | 472,726 | |||||||||
| Enterprise Value | 496,676 | |||||||||
| Net Debt | -2,384 | |||||||||
| Equity Value | 499,060 | |||||||||
| Diluted Shares Outstanding, MM | 46 | |||||||||
| Equity Value Per Share | 10,958.47 |
الفوائد التي ستستمتع بها
- مدخلات التنبؤ المرنة: تعديل الافتراضات الرئيسية دون عناء (النمو ٪ ، الهوامش ، WACC) لاستكشاف سيناريوهات مختلفة.
- البيانات الخاصة بالصناعة: تم تحميل البيانات المالية لـ Akzo Nobel India Limited لإعطاء تحليلك بداية الرأس.
- حسابات DCF الفورية: يحسب القالب تلقائيًا القيمة الحالية الصافية (NPV) والقيمة الجوهرية لراحتك.
- محترف ومصمم: نموذج Excel المكرر المصمم لتلبية متطلبات التقييم الخاصة بك.
- مصنوع للمحللين والمستثمرين: مثالي لاختبار التنبؤات ، وتقييم الاستراتيجيات ، وتحسين وقتك.
الميزات الرئيسية
- مدخلات التنبؤ القابلة للتخصيص: تعديل المعايير الأساسية مثل معدل نمو الإيرادات ونسبة الأرباح قبل الفوائد والضرائب والاستهلاك وإطفاء الدين والاستثمار الرأسمالي.
- التقييم الفوري لـ DCF: يحسب بسرعة القيمة الجوهرية، NPV، والمقاييس المالية المختلفة.
- دقة عالية الدقة: يستفيد من البيانات المالية الفعلية لشركة Akzo Nobel India لنتائج تقييم يمكن الاعتماد عليها.
- تحليل السيناريو السهل: استكشاف الافتراضات المختلفة دون عناء وتقييم آثارها.
- حل فعال للوقت: تجنب متاعب إنشاء نماذج تقييم معقدة من الألف إلى الياء.
كيف تعمل
- الخطوة 1: قم بتنزيل قالب Excel الجاهز الذي يحتوي على بيانات لـ Akzo Nobel India Limited (Akzoindians).
- الخطوة 2: راجع الأوراق المملوءة مسبقًا للتعرف على المقاييس الأساسية.
- الخطوة 3: تعديل التنبؤات والافتراضات في الخلايا الصفراء القابلة للتحرير (WACC ، النمو ، الهوامش).
- الخطوة 4: انظر على الفور النتائج المعاد حسابها ، بما في ذلك القيمة الجوهرية لـ Akzo Nobel India Limited (Akzoindians).
- الخطوة 5: اتخاذ قرارات استثمارية مستنيرة أو إنشاء تقارير بناءً على المخرجات التي تم إنشاؤها.
لماذا تختار حاسبة Akzoindians؟
- دقة: يستخدم بيانات Akzo Nobel المالية الأصلية لنتائج موثوقة.
- القدرة على التكيف: تم تصميمه للمستخدمين لتعديل وتجربة مدخلات مختلفة بسهولة.
- كفاءة: التخلص من الحاجة إلى إنشاء نموذج DCF من الألف إلى الياء.
- مستوى الخبراء: مصنوعة من الدقة والوظائف المتوقعة بواسطة الماليين.
- حدسي: سهل التنقل ، مما يجعله في متناول المستخدمين الذين لديهم مهارات النمذجة المالية المحدودة.
من يمكنه الاستفادة من هذا المنتج؟
- المستثمرون: تقييم تقييم Akzo Nobel India Limited (Akzoindians) قبل اتخاذ قرارات الاستثمار.
- الماليين والمحللين الماليين: تحسين عمليات التقييم والتحقق من صحة التوقعات المالية.
- مؤسسو الشركات الناشئة: فهم أساليب التقييم المطبقة على الشركات القائمة مثل Akzo Nobel India Limited.
- الاستشاريون: تقديم تقارير تقييم مفصلة للعملاء الذين يضم Akzo Nobel India Limited (Akzoindians).
- الطلاب والمعلمين: الاستفادة من البيانات الحقيقية من Akzo Nobel India يقتصر على الممارسة وتوجيه تقنيات التقييم.
ما يتضمنه القالب
- نموذج DCF المليء مسبقًا: Akzo Nobel India Limited (Akzoindians) البيانات المالية جاهزة للتحليل الفوري.
- حاسبة WACC: حسابات شاملة لمتوسط تكلفة رأس المال المرجح.
- النسب المالية: تقييم ربحية Akzo Nobel India Limited والرافعة المالية والكفاءة التشغيلية.
- مدخلات قابلة للتحرير: تعديل الافتراضات مثل معدلات النمو والهوامش والنفقات الرأسمالية لتناسب احتياجاتك.
- البيانات المالية: التقارير السنوية والفصلية المتاحة للتحليل المتعمق.
- لوحة القيادة التفاعلية: تصور دون عناء مقاييس ونتائج التقييم الأساسية.
Disclaimer
All information, articles, and product details provided on this website are for general informational and educational purposes only. We do not claim any ownership over, nor do we intend to infringe upon, any trademarks, copyrights, logos, brand names, or other intellectual property mentioned or depicted on this site. Such intellectual property remains the property of its respective owners, and any references here are made solely for identification or informational purposes, without implying any affiliation, endorsement, or partnership.
We make no representations or warranties, express or implied, regarding the accuracy, completeness, or suitability of any content or products presented. Nothing on this website should be construed as legal, tax, investment, financial, medical, or other professional advice. In addition, no part of this site—including articles or product references—constitutes a solicitation, recommendation, endorsement, advertisement, or offer to buy or sell any securities, franchises, or other financial instruments, particularly in jurisdictions where such activity would be unlawful.
All content is of a general nature and may not address the specific circumstances of any individual or entity. It is not a substitute for professional advice or services. Any actions you take based on the information provided here are strictly at your own risk. You accept full responsibility for any decisions or outcomes arising from your use of this website and agree to release us from any liability in connection with your use of, or reliance upon, the content or products found herein.