
|
ALCON Inc. (ALC) تقييم DCF |
Fully Editable: Tailor To Your Needs In Excel Or Sheets
Professional Design: Trusted, Industry-Standard Templates
Investor-Approved Valuation Models
MAC/PC Compatible, Fully Unlocked
No Expertise Is Needed; Easy To Follow
Alcon Inc. (ALC) Bundle
سواء كنت مستثمرًا أو محللًا ، فإن حاسبة ALCON Inc. (ALC) DCF هي المورد الخاص بك للتقييم الدقيق. مزود ببيانات حقيقية من شركة Alcon Inc. ، يمكنك ضبط التوقعات ومراقبة التأثيرات في الوقت الفعلي.
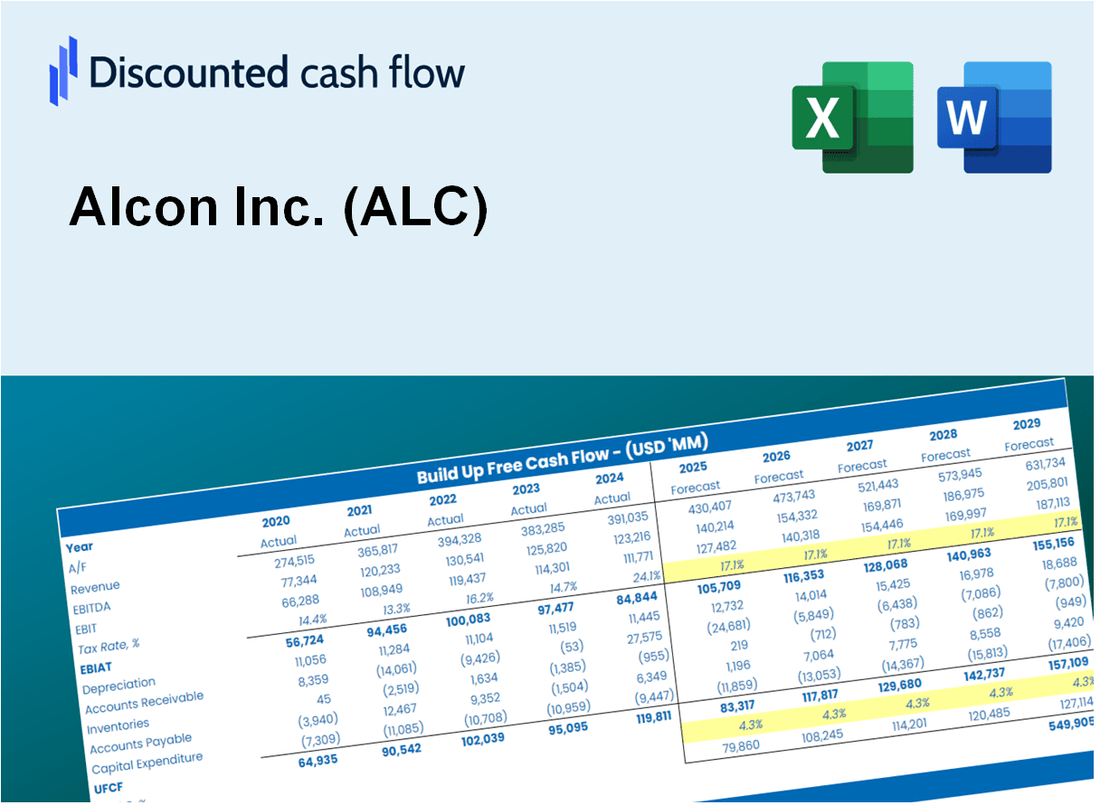
Discounted Cash Flow (DCF) - (USD MM)
| Year | AY1 2020 |
AY2 2021 |
AY3 2022 |
AY4 2023 |
AY5 2024 |
FY1 2025 |
FY2 2026 |
FY3 2027 |
FY4 2028 |
FY5 2029 |
|---|---|---|---|---|---|---|---|---|---|---|
| Revenue | 6,833.0 | 8,291.0 | 8,717.0 | 9,455.0 | 9,911.0 | 10,896.3 | 11,979.5 | 13,170.4 | 14,479.7 | 15,919.1 |
| Revenue Growth, % | 0 | 21.34 | 5.14 | 8.47 | 4.82 | 9.94 | 9.94 | 9.94 | 9.94 | 9.94 |
| EBITDA | 1,180.8 | 1,760.7 | 1,776.4 | 2,242.0 | 2,676.0 | 2,388.7 | 2,626.1 | 2,887.2 | 3,174.2 | 3,489.8 |
| EBITDA, % | 17.28 | 21.24 | 20.38 | 23.71 | 27 | 21.92 | 21.92 | 21.92 | 21.92 | 21.92 |
| Depreciation | 1,723.4 | 1,221.6 | 1,159.8 | 1,221.0 | 1,228.0 | 1,712.1 | 1,882.3 | 2,069.5 | 2,275.2 | 2,501.4 |
| Depreciation, % | 25.22 | 14.73 | 13.31 | 12.91 | 12.39 | 15.71 | 15.71 | 15.71 | 15.71 | 15.71 |
| EBIT | -542.6 | 539.1 | 616.6 | 1,021.0 | 1,448.0 | 676.5 | 743.8 | 817.7 | 899.0 | 988.4 |
| EBIT, % | -7.94 | 6.5 | 7.07 | 10.8 | 14.61 | 6.21 | 6.21 | 6.21 | 6.21 | 6.21 |
| Total Cash | 1,569.0 | 1,578.0 | 980.0 | 1,101.0 | 1,830.0 | 1,816.3 | 1,996.9 | 2,195.4 | 2,413.7 | 2,653.6 |
| Total Cash, percent | .0 | .0 | .0 | .0 | .0 | .0 | .0 | .0 | .0 | .0 |
| Account Receivables | 1,468.0 | 1,593.0 | 1,989.0 | 1,886.0 | 2,082.0 | 2,276.6 | 2,503.0 | 2,751.8 | 3,025.4 | 3,326.1 |
| Account Receivables, % | 21.48 | 19.21 | 22.82 | 19.95 | 21.01 | 20.89 | 20.89 | 20.89 | 20.89 | 20.89 |
| Inventories | 1,644.0 | 1,899.0 | 2,109.0 | 2,322.0 | 2,268.0 | 2,584.6 | 2,841.5 | 3,124.0 | 3,434.6 | 3,776.0 |
| Inventories, % | 24.06 | 22.9 | 24.19 | 24.56 | 22.88 | 23.72 | 23.72 | 23.72 | 23.72 | 23.72 |
| Accounts Payable | 876.0 | 903.0 | 861.0 | 811.0 | 773.0 | 1,088.9 | 1,197.1 | 1,316.1 | 1,447.0 | 1,590.8 |
| Accounts Payable, % | 12.82 | 10.89 | 9.88 | 8.58 | 7.8 | 9.99 | 9.99 | 9.99 | 9.99 | 9.99 |
| Capital Expenditure | -567.0 | -1,180.0 | -745.0 | -851.0 | -670.0 | -1,020.7 | -1,122.2 | -1,233.7 | -1,356.4 | -1,491.2 |
| Capital Expenditure, % | -8.3 | -14.23 | -8.55 | -9 | -6.76 | -9.37 | -9.37 | -9.37 | -9.37 | -9.37 |
| Tax Rate, % | 18.95 | 18.95 | 18.95 | 18.95 | 18.95 | 18.95 | 18.95 | 18.95 | 18.95 | 18.95 |
| EBITAT | -453.7 | 485.0 | 446.1 | 1,195.3 | 1,173.6 | 577.7 | 635.2 | 698.3 | 767.7 | 844.0 |
| Depreciation | ||||||||||
| Changes in Account Receivables | ||||||||||
| Changes in Inventories | ||||||||||
| Changes in Accounts Payable | ||||||||||
| Capital Expenditure | ||||||||||
| UFCF | -1,533.4 | 173.6 | 213.0 | 1,405.3 | 1,551.6 | 1,073.8 | 1,020.3 | 1,121.7 | 1,233.2 | 1,355.8 |
| WACC, % | 6.56 | 6.59 | 6.51 | 6.63 | 6.55 | 6.57 | 6.57 | 6.57 | 6.57 | 6.57 |
| PV UFCF | ||||||||||
| SUM PV UFCF | 4,775.6 | |||||||||
| Long Term Growth Rate, % | 2.00 | |||||||||
| Free cash flow (T + 1) | 1,383 | |||||||||
| Terminal Value | 30,280 | |||||||||
| Present Terminal Value | 22,031 | |||||||||
| Enterprise Value | 26,807 | |||||||||
| Net Debt | 3,452 | |||||||||
| Equity Value | 23,355 | |||||||||
| Diluted Shares Outstanding, MM | 498 | |||||||||
| Equity Value Per Share | 46.94 |
What You Will Get
- Editable Forecast Inputs: Effortlessly modify key assumptions (growth %, margins, WACC) to generate various scenarios.
- Real-World Data: Alcon Inc.'s (ALC) financial data pre-populated to facilitate your analysis.
- Automatic DCF Outputs: The template computes Net Present Value (NPV) and intrinsic value automatically.
- Customizable and Professional: A sleek Excel model that adjusts to your valuation requirements.
- Built for Analysts and Investors: Perfect for evaluating projections, confirming strategies, and enhancing efficiency.
Key Features
- Comprehensive Financial Data: Alcon Inc.'s historical financial reports and pre-filled projections.
- Customizable Parameters: Modify WACC, tax rates, revenue growth, and EBITDA margins as needed.
- Real-Time Insights: Observe Alcon Inc.'s intrinsic value recalculating live.
- Intuitive Visualizations: Dashboard graphs present valuation outcomes and essential metrics.
- Designed for Precision: A professional-grade tool tailored for analysts, investors, and finance professionals.
How It Works
- Step 1: Download the Excel file.
- Step 2: Review pre-entered Alcon Inc. (ALC) data (historical and projected).
- Step 3: Adjust key assumptions (yellow cells) based on your analysis.
- Step 4: View automatic recalculations for Alcon Inc. (ALC)’s intrinsic value.
- Step 5: Use the outputs for investment decisions or reporting.
Why Choose This Calculator for Alcon Inc. (ALC)?
- User-Friendly Interface: Tailored for both novices and seasoned professionals.
- Customizable Inputs: Adjust parameters easily to suit your financial analysis.
- Real-Time Feedback: Observe immediate updates to Alcon’s valuation as you modify inputs.
- Preloaded Data: Comes with Alcon’s actual financial figures for swift evaluations.
- Favored by Experts: Utilized by investors and analysts for making educated decisions.
Who Should Use This Product?
- Healthcare Professionals: Develop comprehensive and accurate valuation models for assessing Alcon Inc. (ALC) investments.
- Corporate Finance Teams: Evaluate valuation scenarios to inform strategic decisions within the organization.
- Consultants and Advisors: Deliver precise valuation insights for clients interested in Alcon Inc. (ALC) stock.
- Students and Educators: Utilize real-world data to enhance learning and practice in financial modeling.
- Investors in Medical Technology: Gain insights into how medical technology companies like Alcon Inc. (ALC) are valued in the market.
What the Template Contains
- Operating and Balance Sheet Data: Pre-filled Alcon Inc. (ALC) historical data and forecasts, including revenue, EBITDA, EBIT, and capital expenditures.
- WACC Calculation: A dedicated sheet for Weighted Average Cost of Capital (WACC), including parameters like Beta, risk-free rate, and share price.
- DCF Valuation (Unlevered and Levered): Editable Discounted Cash Flow models showing intrinsic value with detailed calculations.
- Financial Statements: Pre-loaded financial statements (annual and quarterly) to support analysis.
- Key Ratios: Includes profitability, leverage, and efficiency ratios for Alcon Inc. (ALC).
- Dashboard and Charts: Visual summary of valuation outputs and assumptions to analyze results easily.
Disclaimer
All information, articles, and product details provided on this website are for general informational and educational purposes only. We do not claim any ownership over, nor do we intend to infringe upon, any trademarks, copyrights, logos, brand names, or other intellectual property mentioned or depicted on this site. Such intellectual property remains the property of its respective owners, and any references here are made solely for identification or informational purposes, without implying any affiliation, endorsement, or partnership.
We make no representations or warranties, express or implied, regarding the accuracy, completeness, or suitability of any content or products presented. Nothing on this website should be construed as legal, tax, investment, financial, medical, or other professional advice. In addition, no part of this site—including articles or product references—constitutes a solicitation, recommendation, endorsement, advertisement, or offer to buy or sell any securities, franchises, or other financial instruments, particularly in jurisdictions where such activity would be unlawful.
All content is of a general nature and may not address the specific circumstances of any individual or entity. It is not a substitute for professional advice or services. Any actions you take based on the information provided here are strictly at your own risk. You accept full responsibility for any decisions or outcomes arising from your use of this website and agree to release us from any liability in connection with your use of, or reliance upon, the content or products found herein.