|
ALINS TECHNOLOST ، Inc. (ALGN) DCF تقييم |
Fully Editable: Tailor To Your Needs In Excel Or Sheets
Professional Design: Trusted, Industry-Standard Templates
Investor-Approved Valuation Models
MAC/PC Compatible, Fully Unlocked
No Expertise Is Needed; Easy To Follow
Align Technology, Inc. (ALGN) Bundle
تُمكّنك حاسبة DCF الخاصة بـ ALINS Technology ، Inc. (ALGN) DCF من تقييم تقييم ALIGN Technology ، Inc. مع البيانات المالية في العالم الحقيقي ، مما يوفر مرونة كاملة لتعديل جميع المعلمات الأساسية للتوقعات المحسنة.
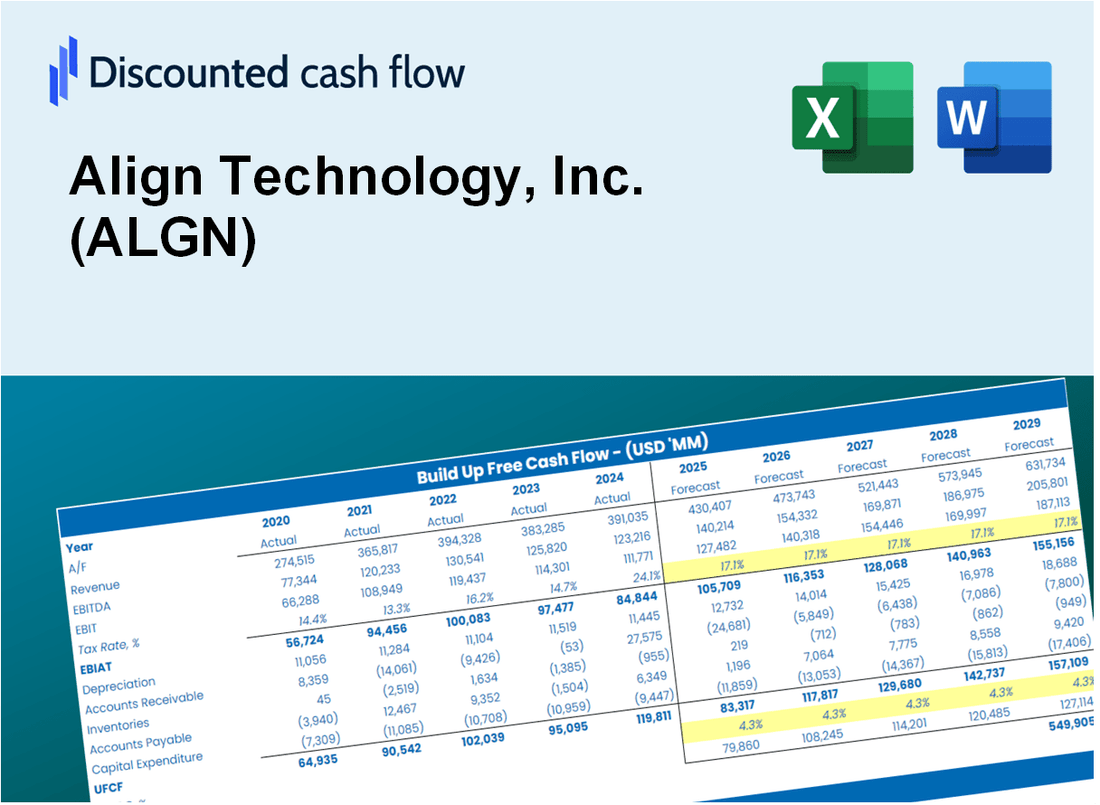
Discounted Cash Flow (DCF) - (USD MM)
| Year | AY1 2020 |
AY2 2021 |
AY3 2022 |
AY4 2023 |
AY5 2024 |
FY1 2025 |
FY2 2026 |
FY3 2027 |
FY4 2028 |
FY5 2029 |
|---|---|---|---|---|---|---|---|---|---|---|
| Revenue | 2,471.9 | 3,952.6 | 3,734.6 | 3,862.3 | 3,999.0 | 4,612.3 | 5,319.6 | 6,135.4 | 7,076.3 | 8,161.5 |
| Revenue Growth, % | 0 | 59.9 | -5.51 | 3.42 | 3.54 | 15.34 | 15.34 | 15.34 | 15.34 | 15.34 |
| EBITDA | 480.7 | 1,085.1 | 779.8 | 799.1 | 816.8 | 1,004.5 | 1,158.6 | 1,336.2 | 1,541.1 | 1,777.5 |
| EBITDA, % | 19.45 | 27.45 | 20.88 | 20.69 | 20.42 | 21.78 | 21.78 | 21.78 | 21.78 | 21.78 |
| Depreciation | 93.5 | 108.7 | 125.8 | 142.4 | 145.0 | 158.8 | 183.2 | 211.3 | 243.7 | 281.0 |
| Depreciation, % | 3.78 | 2.75 | 3.37 | 3.69 | 3.63 | 3.44 | 3.44 | 3.44 | 3.44 | 3.44 |
| EBIT | 387.2 | 976.4 | 654.0 | 656.7 | 671.8 | 845.7 | 975.4 | 1,125.0 | 1,297.5 | 1,496.5 |
| EBIT, % | 15.66 | 24.7 | 17.51 | 17 | 16.8 | 18.34 | 18.34 | 18.34 | 18.34 | 18.34 |
| Total Cash | 960.8 | 1,171.3 | 999.6 | 972.7 | 1,043.9 | 1,351.9 | 1,559.3 | 1,798.4 | 2,074.2 | 2,392.3 |
| Total Cash, percent | .0 | .0 | .0 | .0 | .0 | .0 | .0 | .0 | .0 | .0 |
| Account Receivables | 657.7 | 990.8 | 1,000.2 | 1,047.2 | 1,029.7 | 1,211.3 | 1,397.1 | 1,611.4 | 1,858.5 | 2,143.5 |
| Account Receivables, % | 26.61 | 25.07 | 26.78 | 27.11 | 25.75 | 26.26 | 26.26 | 26.26 | 26.26 | 26.26 |
| Inventories | 139.2 | 230.2 | 338.8 | 296.9 | 254.3 | 318.9 | 367.8 | 424.3 | 489.3 | 564.3 |
| Inventories, % | 5.63 | 5.82 | 9.07 | 7.69 | 6.36 | 6.91 | 6.91 | 6.91 | 6.91 | 6.91 |
| Accounts Payable | 142.1 | 163.9 | 127.9 | 113.1 | 108.7 | 175.0 | 201.8 | 232.7 | 268.4 | 309.6 |
| Accounts Payable, % | 5.75 | 4.15 | 3.42 | 2.93 | 2.72 | 3.79 | 3.79 | 3.79 | 3.79 | 3.79 |
| Capital Expenditure | -154.9 | -401.1 | -291.9 | -177.7 | -115.6 | -292.6 | -337.5 | -389.3 | -449.0 | -517.8 |
| Capital Expenditure, % | -6.27 | -10.15 | -7.82 | -4.6 | -2.89 | -6.34 | -6.34 | -6.34 | -6.34 | -6.34 |
| Tax Rate, % | 30.81 | 30.81 | 30.81 | 30.81 | 30.81 | 30.81 | 30.81 | 30.81 | 30.81 | 30.81 |
| EBITAT | 1,814.4 | 744.6 | 394.8 | 455.8 | 464.8 | 634.6 | 732.0 | 844.2 | 973.7 | 1,123.0 |
| Depreciation | ||||||||||
| Changes in Account Receivables | ||||||||||
| Changes in Inventories | ||||||||||
| Changes in Accounts Payable | ||||||||||
| Capital Expenditure | ||||||||||
| UFCF | 1,098.2 | 49.8 | 74.8 | 400.6 | 549.9 | 320.8 | 369.8 | 426.5 | 491.9 | 567.3 |
| WACC, % | 12.46 | 12.45 | 12.44 | 12.44 | 12.44 | 12.45 | 12.45 | 12.45 | 12.45 | 12.45 |
| PV UFCF | ||||||||||
| SUM PV UFCF | 1,501.1 | |||||||||
| Long Term Growth Rate, % | 4.00 | |||||||||
| Free cash flow (T + 1) | 590 | |||||||||
| Terminal Value | 6,987 | |||||||||
| Present Terminal Value | 3,887 | |||||||||
| Enterprise Value | 5,388 | |||||||||
| Net Debt | -925 | |||||||||
| Equity Value | 6,312 | |||||||||
| Diluted Shares Outstanding, MM | 75 | |||||||||
| Equity Value Per Share | 84.17 |
What You Will Get
- Real Align Data: Preloaded financials – from revenue to EBIT – based on actual and projected figures for Align Technology, Inc. (ALGN).
- Full Customization: Adjust all critical parameters (yellow cells) like WACC, growth %, and tax rates to fit your analysis needs.
- Instant Valuation Updates: Automatic recalculations to analyze the impact of changes on Align Technology’s fair value.
- Versatile Excel Template: Tailored for quick edits, scenario testing, and detailed projections specific to Align Technology, Inc. (ALGN).
- Time-Saving and Accurate: Skip building models from scratch while ensuring precision and flexibility in your evaluations.
Key Features
- Real-Life ALGN Data: Pre-filled with Align Technology’s historical financials and forward-looking projections.
- Fully Customizable Inputs: Adjust revenue growth, margins, WACC, tax rates, and capital expenditures.
- Dynamic Valuation Model: Automatic updates to Net Present Value (NPV) and intrinsic value based on your inputs.
- Scenario Testing: Create multiple forecast scenarios to analyze different valuation outcomes.
- User-Friendly Design: Simple, structured, and designed for professionals and beginners alike.
How It Works
- 1. Access the Template: Download and open the Excel file containing Align Technology, Inc.'s (ALGN) preloaded data.
- 2. Modify Assumptions: Adjust key variables such as growth rates, WACC, and capital expenditures.
- 3. Observe Results Instantly: The DCF model automatically computes intrinsic value and NPV.
- 4. Explore Scenarios: Evaluate multiple forecasts to assess various valuation outcomes.
- 5. Utilize with Assurance: Present professional valuation insights to bolster your decision-making.
Why Choose Align Technology (ALGN)?
- Streamlined Solutions: Access advanced orthodontic tools without the hassle of complex setups.
- Enhanced Accuracy: Cutting-edge technology ensures precise treatment planning and outcomes.
- Fully Adaptable: Customize treatment plans to meet the unique needs of each patient.
- User-Friendly Interface: Intuitive design makes it easy for practitioners to navigate and utilize.
- Endorsed by Professionals: Trusted by orthodontists and dentists for its reliability and effectiveness.
Who Should Use This Product?
- Investors: Accurately estimate Align Technology, Inc.'s (ALGN) fair value before making investment decisions.
- CFOs: Leverage a professional-grade DCF model for financial reporting and analysis related to Align Technology, Inc. (ALGN).
- Consultants: Quickly adapt the template for valuation reports tailored for clients interested in Align Technology, Inc. (ALGN).
- Entrepreneurs: Gain insights into financial modeling practices employed by leading companies like Align Technology, Inc. (ALGN).
- Educators: Use it as a teaching tool to demonstrate valuation methodologies applicable to Align Technology, Inc. (ALGN).
What the Template Contains
- Preloaded ALGN Data: Historical and projected financial data, including revenue, EBIT, and capital expenditures.
- DCF and WACC Models: Professional-grade sheets for calculating intrinsic value and Weighted Average Cost of Capital.
- Editable Inputs: Yellow-highlighted cells for adjusting revenue growth, tax rates, and discount rates.
- Financial Statements: Comprehensive annual and quarterly financials for deeper analysis.
- Key Ratios: Profitability, leverage, and efficiency ratios to evaluate performance.
- Dashboard and Charts: Visual summaries of valuation outcomes and assumptions.
Disclaimer
All information, articles, and product details provided on this website are for general informational and educational purposes only. We do not claim any ownership over, nor do we intend to infringe upon, any trademarks, copyrights, logos, brand names, or other intellectual property mentioned or depicted on this site. Such intellectual property remains the property of its respective owners, and any references here are made solely for identification or informational purposes, without implying any affiliation, endorsement, or partnership.
We make no representations or warranties, express or implied, regarding the accuracy, completeness, or suitability of any content or products presented. Nothing on this website should be construed as legal, tax, investment, financial, medical, or other professional advice. In addition, no part of this site—including articles or product references—constitutes a solicitation, recommendation, endorsement, advertisement, or offer to buy or sell any securities, franchises, or other financial instruments, particularly in jurisdictions where such activity would be unlawful.
All content is of a general nature and may not address the specific circumstances of any individual or entity. It is not a substitute for professional advice or services. Any actions you take based on the information provided here are strictly at your own risk. You accept full responsibility for any decisions or outcomes arising from your use of this website and agree to release us from any liability in connection with your use of, or reliance upon, the content or products found herein.