
|
مجموعة ألاسكا الجوية، إنك. (ALK) تقييم DCF |
Fully Editable: Tailor To Your Needs In Excel Or Sheets
Professional Design: Trusted, Industry-Standard Templates
Investor-Approved Valuation Models
MAC/PC Compatible, Fully Unlocked
No Expertise Is Needed; Easy To Follow
Alaska Air Group, Inc. (ALK) Bundle
تعظيم الكفاءة وتحسين الدقة مع حاسبة (ALK) DCF! باستخدام بيانات حقيقية من Alaska Air Group ، Inc. والافتراضات القابلة للتخصيص ، فإن هذه الأداة تمكنك من التنبؤ وتحليل وقيمة (ALK) مثل المستثمر المحنك.
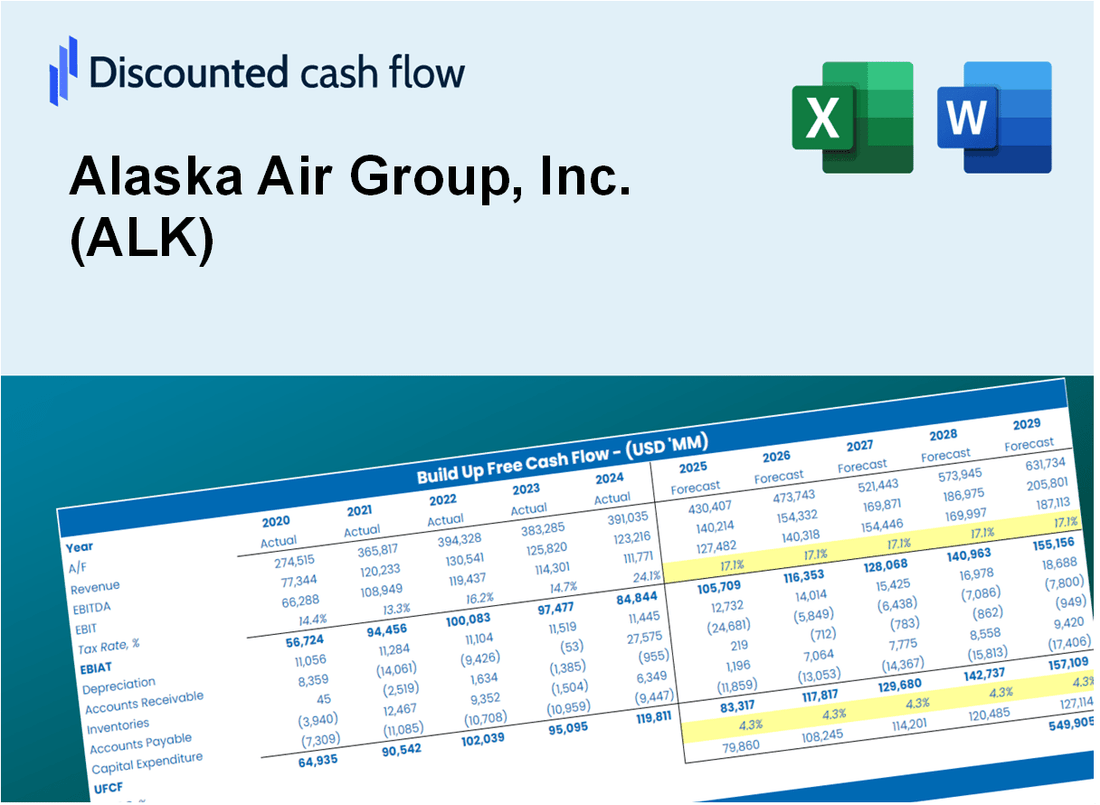
Discounted Cash Flow (DCF) - (USD MM)
| Year | AY1 2020 |
AY2 2021 |
AY3 2022 |
AY4 2023 |
AY5 2024 |
FY1 2025 |
FY2 2026 |
FY3 2027 |
FY4 2028 |
FY5 2029 |
|---|---|---|---|---|---|---|---|---|---|---|
| Revenue | 3,566.0 | 6,176.0 | 9,646.0 | 10,426.0 | 11,735.0 | 16,136.1 | 22,187.9 | 30,509.4 | 41,951.8 | 57,685.6 |
| Revenue Growth, % | 0 | 73.19 | 56.19 | 8.09 | 12.56 | 37.5 | 37.5 | 37.5 | 37.5 | 37.5 |
| EBITDA | -1,918.0 | 137.0 | 1,104.0 | 1,244.0 | 1,425.0 | -517.9 | -712.1 | -979.2 | -1,346.4 | -1,851.4 |
| EBITDA, % | -53.79 | 2.22 | 11.45 | 11.93 | 12.14 | -3.21 | -3.21 | -3.21 | -3.21 | -3.21 |
| Depreciation | 420.0 | 394.0 | 398.0 | 426.0 | 536.0 | 998.4 | 1,372.9 | 1,887.7 | 2,595.7 | 3,569.2 |
| Depreciation, % | 11.78 | 6.38 | 4.13 | 4.09 | 4.57 | 6.19 | 6.19 | 6.19 | 6.19 | 6.19 |
| EBIT | -2,338.0 | -257.0 | 706.0 | 818.0 | 889.0 | -1,516.3 | -2,085.0 | -2,866.9 | -3,942.2 | -5,420.6 |
| EBIT, % | -65.56 | -4.16 | 7.32 | 7.85 | 7.58 | -9.4 | -9.4 | -9.4 | -9.4 | -9.4 |
| Total Cash | 3,346.0 | 3,116.0 | 2,417.0 | 1,797.0 | 2,475.0 | 6,701.9 | 9,215.4 | 12,671.6 | 17,424.0 | 23,958.8 |
| Total Cash, percent | .0 | .0 | .0 | .0 | .0 | .0 | .0 | .0 | .0 | .0 |
| Account Receivables | 480.0 | 546.0 | 296.0 | 383.0 | 558.0 | 1,090.7 | 1,499.8 | 2,062.3 | 2,835.8 | 3,899.3 |
| Account Receivables, % | 13.46 | 8.84 | 3.07 | 3.67 | 4.76 | 6.76 | 6.76 | 6.76 | 6.76 | 6.76 |
| Inventories | 57.0 | 62.0 | 104.0 | 116.0 | 199.0 | 209.4 | 287.9 | 395.9 | 544.4 | 748.6 |
| Inventories, % | 1.6 | 1 | 1.08 | 1.11 | 1.7 | 1.3 | 1.3 | 1.3 | 1.3 | 1.3 |
| Accounts Payable | 108.0 | 200.0 | 221.0 | 207.0 | 186.0 | 391.4 | 538.2 | 740.1 | 1,017.6 | 1,399.3 |
| Accounts Payable, % | 3.03 | 3.24 | 2.29 | 1.99 | 1.59 | 2.43 | 2.43 | 2.43 | 2.43 | 2.43 |
| Capital Expenditure | -206.0 | -292.0 | -1,671.0 | -1,494.0 | -1,281.0 | -1,712.8 | -2,355.2 | -3,238.5 | -4,453.1 | -6,123.2 |
| Capital Expenditure, % | -5.78 | -4.73 | -17.32 | -14.33 | -10.92 | -10.61 | -10.61 | -10.61 | -10.61 | -10.61 |
| Tax Rate, % | 27.52 | 27.52 | 27.52 | 27.52 | 27.52 | 27.52 | 27.52 | 27.52 | 27.52 | 27.52 |
| EBITAT | -1,682.3 | -195.3 | 518.3 | 595.1 | 644.3 | -1,111.7 | -1,528.7 | -2,102.0 | -2,890.4 | -3,974.4 |
| Depreciation | ||||||||||
| Changes in Account Receivables | ||||||||||
| Changes in Inventories | ||||||||||
| Changes in Accounts Payable | ||||||||||
| Capital Expenditure | ||||||||||
| UFCF | -1,897.3 | -72.3 | -525.7 | -585.9 | -379.7 | -2,163.9 | -2,851.9 | -3,921.4 | -5,392.1 | -7,414.4 |
| WACC, % | 5.84 | 5.92 | 5.87 | 5.86 | 5.85 | 5.87 | 5.87 | 5.87 | 5.87 | 5.87 |
| PV UFCF | ||||||||||
| SUM PV UFCF | -17,761.2 | |||||||||
| Long Term Growth Rate, % | 4.00 | |||||||||
| Free cash flow (T + 1) | -7,711 | |||||||||
| Terminal Value | -412,946 | |||||||||
| Present Terminal Value | -310,516 | |||||||||
| Enterprise Value | -328,277 | |||||||||
| Net Debt | 5,192 | |||||||||
| Equity Value | -333,469 | |||||||||
| Diluted Shares Outstanding, MM | 128 | |||||||||
| Equity Value Per Share | -2,597.68 |
What You Will Get
- Real ALK Financial Data: Pre-filled with Alaska Air Group’s historical and projected data for precise analysis.
- Fully Editable Template: Modify key inputs like revenue growth, WACC, and EBITDA % with ease.
- Automatic Calculations: See Alaska Air Group’s intrinsic value update instantly based on your changes.
- Professional Valuation Tool: Designed for investors, analysts, and consultants seeking accurate DCF results.
- User-Friendly Design: Simple structure and clear instructions for all experience levels.
Key Features
- Comprehensive DCF Calculator: Features detailed unlevered and levered DCF valuation models tailored for Alaska Air Group, Inc. (ALK).
- WACC Calculator: Pre-configured Weighted Average Cost of Capital sheet with adjustable inputs for precise analysis.
- Customizable Forecast Assumptions: Adjust growth rates, capital expenditures, and discount rates to fit your analysis needs.
- Integrated Financial Ratios: Evaluate profitability, leverage, and efficiency ratios specific to Alaska Air Group, Inc. (ALK).
- Interactive Dashboard and Charts: Visual representations provide a summary of key valuation metrics for straightforward analysis.
How It Works
- Download: Get the pre-prepared Excel file featuring Alaska Air Group, Inc.'s (ALK) financial data.
- Customize: Tailor forecasts such as revenue growth, EBITDA %, and WACC to your needs.
- Update Automatically: The intrinsic value and NPV calculations refresh in real-time.
- Test Scenarios: Generate various projections and instantly compare results.
- Make Decisions: Leverage the valuation outcomes to inform your investment strategy.
Why Choose This Calculator for Alaska Air Group, Inc. (ALK)?
- Accurate Data: Up-to-date Alaska Air financials ensure trustworthy valuation outcomes.
- Customizable: Modify essential parameters such as growth rates, WACC, and tax rates to align with your forecasts.
- Time-Saving: Pre-configured calculations remove the hassle of starting from scratch.
- Professional-Grade Tool: Tailored for investors, analysts, and consultants in the aviation sector.
- User-Friendly: Easy-to-navigate design and guided instructions make it accessible for all users.
Who Should Use This Product?
- Investors: Accurately estimate Alaska Air Group’s fair value before making investment decisions.
- CFOs: Leverage a professional-grade DCF model for financial reporting and analysis specific to Alaska Air Group (ALK).
- Consultants: Quickly adapt the template for valuation reports tailored for clients in the airline industry.
- Entrepreneurs: Gain insights into financial modeling practices utilized by leading airlines like Alaska Air Group (ALK).
- Educators: Use it as a teaching tool to demonstrate valuation methodologies relevant to the aviation sector.
What the Template Contains
- Pre-Filled DCF Model: Alaska Air Group’s (ALK) financial data preloaded for immediate use.
- WACC Calculator: Detailed calculations for Weighted Average Cost of Capital.
- Financial Ratios: Evaluate Alaska Air Group’s (ALK) profitability, leverage, and efficiency.
- Editable Inputs: Change assumptions such as growth, margins, and CAPEX to fit your scenarios.
- Financial Statements: Annual and quarterly reports to support detailed analysis.
- Interactive Dashboard: Easily visualize key valuation metrics and results.
Disclaimer
All information, articles, and product details provided on this website are for general informational and educational purposes only. We do not claim any ownership over, nor do we intend to infringe upon, any trademarks, copyrights, logos, brand names, or other intellectual property mentioned or depicted on this site. Such intellectual property remains the property of its respective owners, and any references here are made solely for identification or informational purposes, without implying any affiliation, endorsement, or partnership.
We make no representations or warranties, express or implied, regarding the accuracy, completeness, or suitability of any content or products presented. Nothing on this website should be construed as legal, tax, investment, financial, medical, or other professional advice. In addition, no part of this site—including articles or product references—constitutes a solicitation, recommendation, endorsement, advertisement, or offer to buy or sell any securities, franchises, or other financial instruments, particularly in jurisdictions where such activity would be unlawful.
All content is of a general nature and may not address the specific circumstances of any individual or entity. It is not a substitute for professional advice or services. Any actions you take based on the information provided here are strictly at your own risk. You accept full responsibility for any decisions or outcomes arising from your use of this website and agree to release us from any liability in connection with your use of, or reliance upon, the content or products found herein.