
|
Alkami Technology، Inc. (ALKT) تقييم DCF |
Fully Editable: Tailor To Your Needs In Excel Or Sheets
Professional Design: Trusted, Industry-Standard Templates
Investor-Approved Valuation Models
MAC/PC Compatible, Fully Unlocked
No Expertise Is Needed; Easy To Follow
Alkami Technology, Inc. (ALKT) Bundle
هل تبحث عن تقييم القيمة الجوهرية لشركة Alkami Technology، Inc. ؟ تدمج حاسبة ALKT DCF الخاصة بنا بيانات العالم الحقيقي مع ميزات التخصيص الشاملة، مما يسمح لك بتحسين توقعاتك وتعزيز خيارات الاستثمار الخاصة بك.
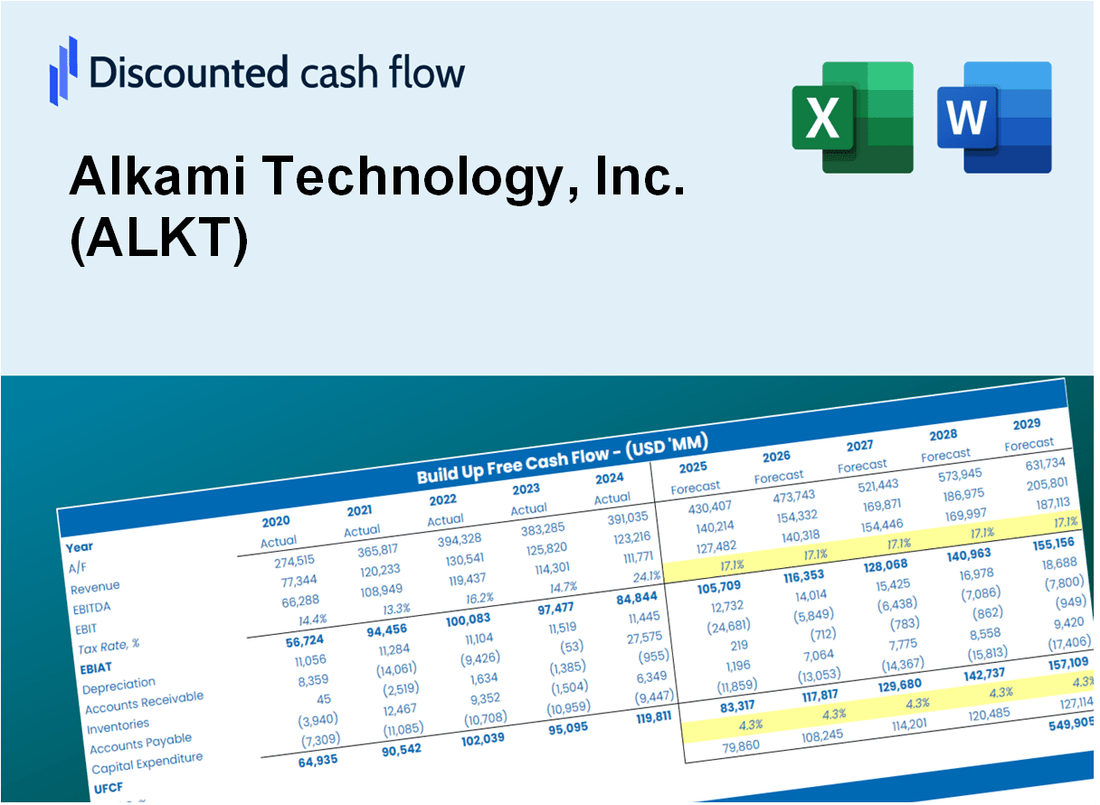
Discounted Cash Flow (DCF) - (USD MM)
| Year | AY1 2020 |
AY2 2021 |
AY3 2022 |
AY4 2023 |
AY5 2024 |
FY1 2025 |
FY2 2026 |
FY3 2027 |
FY4 2028 |
FY5 2029 |
|---|---|---|---|---|---|---|---|---|---|---|
| Revenue | 112.1 | 152.2 | 204.3 | 264.8 | 333.8 | 438.7 | 576.5 | 757.6 | 995.6 | 1,308.3 |
| Revenue Growth, % | 0 | 35.68 | 34.25 | 29.65 | 26.06 | 31.41 | 31.41 | 31.41 | 31.41 | 31.41 |
| EBITDA | -48.1 | -42.0 | -47.1 | -44.9 | -29.6 | -104.7 | -137.6 | -180.8 | -237.7 | -312.3 |
| EBITDA, % | -42.88 | -27.62 | -23.07 | -16.94 | -8.85 | -23.87 | -23.87 | -23.87 | -23.87 | -23.87 |
| Depreciation | 2.8 | 3.4 | 8.1 | 10.6 | 10.5 | 13.9 | 18.3 | 24.0 | 31.6 | 41.5 |
| Depreciation, % | 2.47 | 2.26 | 3.95 | 4.01 | 3.15 | 3.17 | 3.17 | 3.17 | 3.17 | 3.17 |
| EBIT | -50.9 | -45.5 | -55.2 | -55.5 | -40.1 | -118.6 | -155.9 | -204.9 | -269.2 | -353.8 |
| EBIT, % | -45.36 | -29.88 | -27.02 | -20.95 | -12 | -27.04 | -27.04 | -27.04 | -27.04 | -27.04 |
| Total Cash | 166.8 | 308.6 | 196.4 | 92.1 | 115.7 | 320.8 | 421.5 | 553.9 | 727.9 | 956.5 |
| Total Cash, percent | .0 | .0 | .0 | .0 | .0 | .0 | .0 | .0 | .0 | .0 |
| Account Receivables | 14.1 | 20.8 | 26.2 | 35.5 | 38.7 | 56.3 | 73.9 | 97.1 | 127.7 | 167.8 |
| Account Receivables, % | 12.58 | 13.68 | 12.85 | 13.4 | 11.6 | 12.82 | 12.82 | 12.82 | 12.82 | 12.82 |
| Inventories | .0 | .0 | .0 | .0 | .0 | .0 | .0 | .0 | .0 | .0 |
| Inventories, % | 0 | 0 | 0 | 0 | 0 | 0 | 0 | 0 | 0 | 0 |
| Accounts Payable | .4 | 3.6 | 4.3 | 7.5 | 6.1 | 8.3 | 10.9 | 14.4 | 18.9 | 24.8 |
| Accounts Payable, % | 0.32102 | 2.4 | 2.1 | 2.82 | 1.84 | 1.9 | 1.9 | 1.9 | 1.9 | 1.9 |
| Capital Expenditure | -2.1 | -3.7 | -4.7 | -1.1 | -1.2 | -6.5 | -8.5 | -11.2 | -14.7 | -19.4 |
| Capital Expenditure, % | -1.91 | -2.43 | -2.3 | -0.3995 | -0.35795 | -1.48 | -1.48 | -1.48 | -1.48 | -1.48 |
| Tax Rate, % | -0.75999 | -0.75999 | -0.75999 | -0.75999 | -0.75999 | -0.75999 | -0.75999 | -0.75999 | -0.75999 | -0.75999 |
| EBITAT | -51.4 | -45.6 | -54.8 | -55.5 | -40.4 | -118.5 | -155.7 | -204.5 | -268.8 | -353.2 |
| Depreciation | ||||||||||
| Changes in Account Receivables | ||||||||||
| Changes in Inventories | ||||||||||
| Changes in Accounts Payable | ||||||||||
| Capital Expenditure | ||||||||||
| UFCF | -64.5 | -49.3 | -56.2 | -52.0 | -35.6 | -126.4 | -161.0 | -211.5 | -278.0 | -365.3 |
| WACC, % | 6.29 | 6.29 | 6.29 | 6.29 | 6.29 | 6.29 | 6.29 | 6.29 | 6.29 | 6.29 |
| PV UFCF | ||||||||||
| SUM PV UFCF | -924.5 | |||||||||
| Long Term Growth Rate, % | 2.00 | |||||||||
| Free cash flow (T + 1) | -373 | |||||||||
| Terminal Value | -8,678 | |||||||||
| Present Terminal Value | -6,395 | |||||||||
| Enterprise Value | -7,320 | |||||||||
| Net Debt | -76 | |||||||||
| Equity Value | -7,244 | |||||||||
| Diluted Shares Outstanding, MM | 99 | |||||||||
| Equity Value Per Share | -73.25 |
What You Will Get
- Real ALKT Financial Data: Pre-filled with Alkami Technology’s historical and projected data for precise analysis.
- Fully Editable Template: Modify key inputs like revenue growth, WACC, and EBITDA % with ease.
- Automatic Calculations: See Alkami Technology’s intrinsic value update instantly based on your changes.
- Professional Valuation Tool: Designed for investors, analysts, and consultants seeking accurate DCF results.
- User-Friendly Design: Simple structure and clear instructions for all experience levels.
Key Features
- Comprehensive Financial Data: Gain access to precise historical figures and future forecasts tailored for Alkami Technology, Inc. (ALKT).
- Adjustable Forecast Parameters: Modify highlighted fields such as WACC, growth rates, and profit margins to suit your analysis.
- Real-time Calculations: Enjoy automatic updates for DCF, Net Present Value (NPV), and cash flow assessments.
- Interactive Dashboard: View easy-to-understand charts and summaries that clearly present your valuation insights.
- Designed for All Skill Levels: An intuitive layout crafted for investors, CFOs, and consultants alike.
How It Works
- Step 1: Download the prebuilt Excel template featuring Alkami Technology, Inc.'s (ALKT) data.
- Step 2: Review the pre-filled sheets to familiarize yourself with the key metrics.
- Step 3: Modify forecasts and assumptions in the editable yellow cells (WACC, growth, margins).
- Step 4: Instantly see the recalculated results, including Alkami Technology, Inc.'s (ALKT) intrinsic value.
- Step 5: Make well-informed investment decisions or create reports based on the outputs.
Why Choose Alkami Technology, Inc. (ALKT) Calculator?
- Precision: Utilizes real Alkami financial data for reliable calculations.
- Adaptability: Built for users to easily adjust and experiment with input variables.
- Efficiency: Avoid the complexities of creating a financial model from the ground up.
- Expert-Level: Crafted with the accuracy and functionality expected by financial professionals.
- Intuitive: Simple to navigate, suitable for users with varying levels of financial expertise.
Who Should Use This Product?
- Finance Students: Master financial modeling techniques and apply them with real-time data from Alkami Technology, Inc. (ALKT).
- Academics: Integrate advanced financial models into your teaching or research focused on fintech.
- Investors: Evaluate your investment strategies and analyze the market performance of Alkami Technology, Inc. (ALKT).
- Analysts: Enhance your analysis process with a tailored, ready-to-use financial model for Alkami Technology, Inc. (ALKT).
- Small Business Owners: Understand the valuation methodologies used for tech companies like Alkami Technology, Inc. (ALKT).
What the Template Contains
- Operating and Balance Sheet Data: Pre-filled Alkami Technology historical data and forecasts, including revenue, EBITDA, EBIT, and capital expenditures.
- WACC Calculation: A dedicated sheet for Weighted Average Cost of Capital (WACC), featuring parameters like Beta, risk-free rate, and share price.
- DCF Valuation (Unlevered and Levered): Editable Discounted Cash Flow models illustrating intrinsic value with comprehensive calculations.
- Financial Statements: Pre-loaded financial statements (annual and quarterly) to facilitate analysis.
- Key Ratios: Includes profitability, leverage, and efficiency ratios for Alkami Technology.
- Dashboard and Charts: Visual summary of valuation outputs and assumptions for easy result analysis.
Disclaimer
All information, articles, and product details provided on this website are for general informational and educational purposes only. We do not claim any ownership over, nor do we intend to infringe upon, any trademarks, copyrights, logos, brand names, or other intellectual property mentioned or depicted on this site. Such intellectual property remains the property of its respective owners, and any references here are made solely for identification or informational purposes, without implying any affiliation, endorsement, or partnership.
We make no representations or warranties, express or implied, regarding the accuracy, completeness, or suitability of any content or products presented. Nothing on this website should be construed as legal, tax, investment, financial, medical, or other professional advice. In addition, no part of this site—including articles or product references—constitutes a solicitation, recommendation, endorsement, advertisement, or offer to buy or sell any securities, franchises, or other financial instruments, particularly in jurisdictions where such activity would be unlawful.
All content is of a general nature and may not address the specific circumstances of any individual or entity. It is not a substitute for professional advice or services. Any actions you take based on the information provided here are strictly at your own risk. You accept full responsibility for any decisions or outcomes arising from your use of this website and agree to release us from any liability in connection with your use of, or reliance upon, the content or products found herein.