
|
Astronova ، Inc. (الكثير) تقييم DCF |
Fully Editable: Tailor To Your Needs In Excel Or Sheets
Professional Design: Trusted, Industry-Standard Templates
Investor-Approved Valuation Models
MAC/PC Compatible, Fully Unlocked
No Expertise Is Needed; Easy To Follow
AstroNova, Inc. (ALOT) Bundle
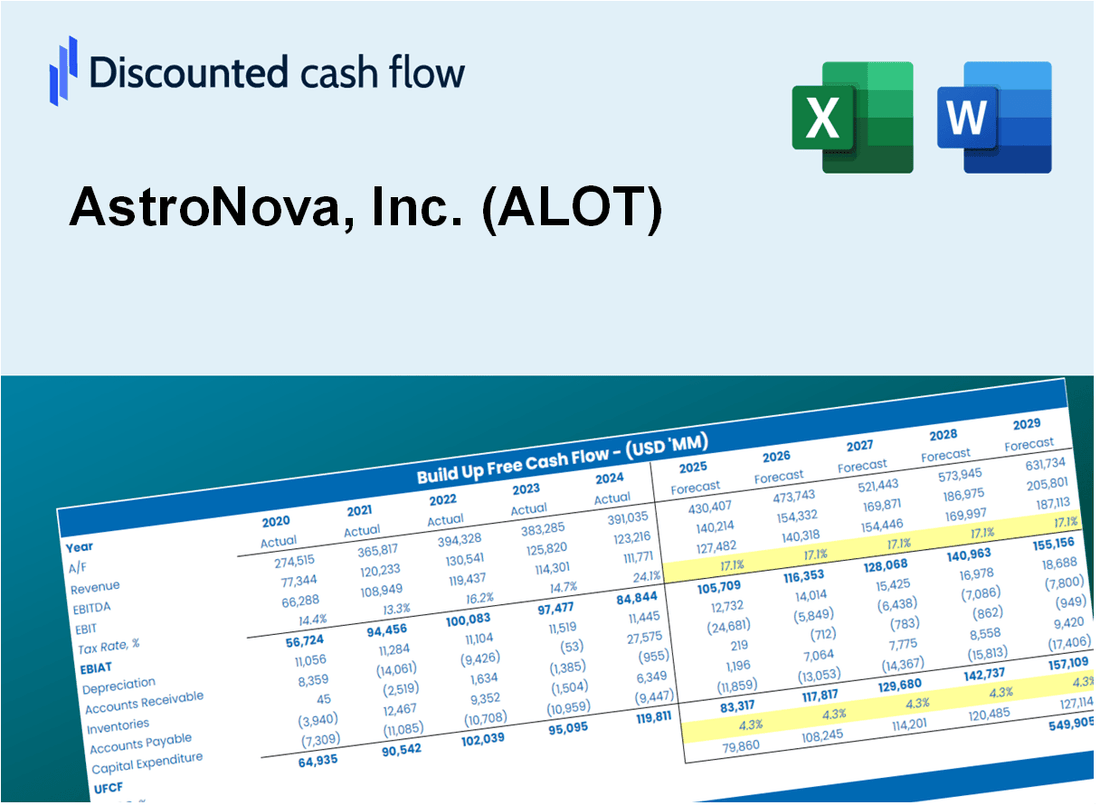
تُمكّنك حاسبة DCF الخاصة بـ Astronova ، Inc. (TAL) من تقييم تقييم Astronova باستخدام البيانات المالية في العالم الحقيقي وتوفر مرونة كاملة لتعديل جميع المعلمات الأساسية للتوقعات المحسنة.
Discounted Cash Flow (DCF) - (USD MM)
| Year | AY1 2021 |
AY2 2022 |
AY3 2023 |
AY4 2024 |
AY5 2025 |
FY1 2026 |
FY2 2027 |
FY3 2028 |
FY4 2029 |
FY5 2030 |
|---|---|---|---|---|---|---|---|---|---|---|
| Revenue | 116.0 | 117.5 | 142.5 | 148.1 | 151.3 | 162.1 | 173.7 | 186.1 | 199.5 | 213.7 |
| Revenue Growth, % | 0 | 1.25 | 21.32 | 3.9 | 2.16 | 7.16 | 7.16 | 7.16 | 7.16 | 7.16 |
| EBITDA | 8.4 | 8.3 | 10.1 | 13.0 | -4.3 | 8.8 | 9.5 | 10.2 | 10.9 | 11.7 |
| EBITDA, % | 7.25 | 7.02 | 7.06 | 8.8 | -2.84 | 5.46 | 5.46 | 5.46 | 5.46 | 5.46 |
| Depreciation | 6.0 | 4.0 | 3.9 | 4.3 | 4.8 | 5.6 | 6.0 | 6.5 | 6.9 | 7.4 |
| Depreciation, % | 5.16 | 3.4 | 2.75 | 2.88 | 3.16 | 3.47 | 3.47 | 3.47 | 3.47 | 3.47 |
| EBIT | 2.4 | 4.3 | 6.1 | 8.8 | -9.1 | 3.2 | 3.5 | 3.7 | 4.0 | 4.3 |
| EBIT, % | 2.1 | 3.62 | 4.31 | 5.92 | -6 | 1.99 | 1.99 | 1.99 | 1.99 | 1.99 |
| Total Cash | 11.4 | 5.3 | 3.9 | 4.5 | 5.1 | 7.6 | 8.2 | 8.8 | 9.4 | 10.1 |
| Total Cash, percent | .0 | .0 | .0 | .0 | .0 | .0 | .0 | .0 | .0 | .0 |
| Account Receivables | 17.4 | 17.1 | 21.6 | 23.1 | 21.2 | 24.1 | 25.8 | 27.7 | 29.7 | 31.8 |
| Account Receivables, % | 15.01 | 14.58 | 15.15 | 15.57 | 14.03 | 14.87 | 14.87 | 14.87 | 14.87 | 14.87 |
| Inventories | 30.1 | 34.6 | 51.3 | 46.4 | 47.9 | 50.0 | 53.6 | 57.5 | 61.6 | 66.0 |
| Inventories, % | 25.91 | 29.46 | 36.01 | 31.31 | 31.66 | 30.87 | 30.87 | 30.87 | 30.87 | 30.87 |
| Accounts Payable | 5.7 | 8.6 | 8.5 | 8.1 | 7.9 | 9.4 | 10.0 | 10.8 | 11.5 | 12.4 |
| Accounts Payable, % | 4.94 | 7.31 | 5.95 | 5.45 | 5.24 | 5.78 | 5.78 | 5.78 | 5.78 | 5.78 |
| Capital Expenditure | -2.6 | -1.8 | -.2 | -.9 | -1.2 | -1.7 | -1.8 | -2.0 | -2.1 | -2.3 |
| Capital Expenditure, % | -2.23 | -1.53 | -0.16067 | -0.59087 | -0.77008 | -1.06 | -1.06 | -1.06 | -1.06 | -1.06 |
| Tax Rate, % | -17.92 | -17.92 | -17.92 | -17.92 | -17.92 | -17.92 | -17.92 | -17.92 | -17.92 | -17.92 |
| EBITAT | 1.4 | 3.9 | 4.8 | 6.8 | -10.7 | 2.6 | 2.8 | 3.0 | 3.2 | 3.5 |
| Depreciation | ||||||||||
| Changes in Account Receivables | ||||||||||
| Changes in Inventories | ||||||||||
| Changes in Accounts Payable | ||||||||||
| Capital Expenditure | ||||||||||
| UFCF | -36.9 | 4.7 | -12.8 | 13.3 | -6.9 | 2.9 | 2.4 | 2.5 | 2.7 | 2.9 |
| WACC, % | 5.81 | 6.72 | 6.35 | 6.33 | 6.96 | 6.43 | 6.43 | 6.43 | 6.43 | 6.43 |
| PV UFCF | ||||||||||
| SUM PV UFCF | 11.2 | |||||||||
| Long Term Growth Rate, % | 0.50 | |||||||||
| Free cash flow (T + 1) | 3 | |||||||||
| Terminal Value | 49 | |||||||||
| Present Terminal Value | 36 | |||||||||
| Enterprise Value | 47 | |||||||||
| Net Debt | 43 | |||||||||
| Equity Value | 4 | |||||||||
| Diluted Shares Outstanding, MM | 8 | |||||||||
| Equity Value Per Share | 0.50 |
What You Will Get
- Editable Forecast Inputs: Easily modify assumptions (growth %, margins, WACC) to explore various scenarios tailored to AstroNova, Inc. (ALOT).
- Real-World Data: AstroNova’s financial data pre-filled to expedite your analysis and decision-making.
- Automatic DCF Outputs: The template automatically computes Net Present Value (NPV) and intrinsic value for AstroNova, Inc. (ALOT).
- Customizable and Professional: A sleek Excel model that adjusts to your specific valuation requirements.
- Built for Analysts and Investors: Perfect for evaluating projections, validating strategies, and enhancing efficiency.
Key Features
- Customizable Financial Metrics: Adjust key variables such as revenue growth, operating margins, and investment costs.
- Instant DCF Valuation: Quickly computes intrinsic value, NPV, and additional financial metrics.
- High-Precision Accuracy: Leverages AstroNova's actual financial data for reliable valuation results.
- Effortless Scenario Testing: Easily evaluate various assumptions and analyze different results.
- Efficiency Booster: Avoid the hassle of constructing intricate valuation models from the ground up.
How It Works
- Step 1: Download the prebuilt Excel template featuring AstroNova, Inc.'s (ALOT) data.
- Step 2: Navigate through the pre-filled sheets to familiarize yourself with the key metrics.
- Step 3: Modify forecasts and assumptions in the editable yellow cells (WACC, growth, margins).
- Step 4: Instantly see recalculated results, including AstroNova, Inc.'s (ALOT) intrinsic value.
- Step 5: Make informed investment decisions or create reports based on the outputs.
Why Choose AstroNova, Inc. (ALOT)?
- Innovative Solutions: Cutting-edge technology tailored for your data visualization needs.
- Enhanced Efficiency: Streamlined processes that save you time and resources.
- Customizable Options: Flexible products that can be adapted to your specific requirements.
- User-Friendly Design: Intuitive interfaces that make it easy for anyone to use.
- Industry Expertise: Backed by years of experience and trusted by professionals worldwide.
Who Should Use This Product?
- Engineering Students: Explore data visualization techniques and apply them with real-world applications.
- Researchers: Integrate advanced printing and data analysis methods into your studies.
- Manufacturers: Evaluate your production processes and enhance quality control using AstroNova's solutions.
- Data Analysts: Optimize your reporting with customizable data presentation tools.
- Small Business Owners: Understand how data-driven decisions can improve operational efficiency in your business.
What the AstroNova, Inc. (ALOT) Template Contains
- Comprehensive DCF Model: Editable template featuring detailed valuation calculations tailored for AstroNova.
- Real-World Data: AstroNova’s historical and projected financials preloaded for in-depth analysis.
- Customizable Parameters: Modify WACC, growth rates, and tax assumptions to explore various scenarios.
- Financial Statements: Complete annual and quarterly breakdowns for enhanced insights into performance.
- Key Ratios: Integrated analysis for profitability, efficiency, and leverage metrics specific to AstroNova.
- Dashboard with Visual Outputs: Interactive charts and tables for clear and actionable results.
Disclaimer
All information, articles, and product details provided on this website are for general informational and educational purposes only. We do not claim any ownership over, nor do we intend to infringe upon, any trademarks, copyrights, logos, brand names, or other intellectual property mentioned or depicted on this site. Such intellectual property remains the property of its respective owners, and any references here are made solely for identification or informational purposes, without implying any affiliation, endorsement, or partnership.
We make no representations or warranties, express or implied, regarding the accuracy, completeness, or suitability of any content or products presented. Nothing on this website should be construed as legal, tax, investment, financial, medical, or other professional advice. In addition, no part of this site—including articles or product references—constitutes a solicitation, recommendation, endorsement, advertisement, or offer to buy or sell any securities, franchises, or other financial instruments, particularly in jurisdictions where such activity would be unlawful.
All content is of a general nature and may not address the specific circumstances of any individual or entity. It is not a substitute for professional advice or services. Any actions you take based on the information provided here are strictly at your own risk. You accept full responsibility for any decisions or outcomes arising from your use of this website and agree to release us from any liability in connection with your use of, or reliance upon, the content or products found herein.