
|
Amazon.com ، Inc. (AMZN) تقييم DCF |
Fully Editable: Tailor To Your Needs In Excel Or Sheets
Professional Design: Trusted, Industry-Standard Templates
Investor-Approved Valuation Models
MAC/PC Compatible, Fully Unlocked
No Expertise Is Needed; Easy To Follow
Amazon.com, Inc. (AMZN) Bundle
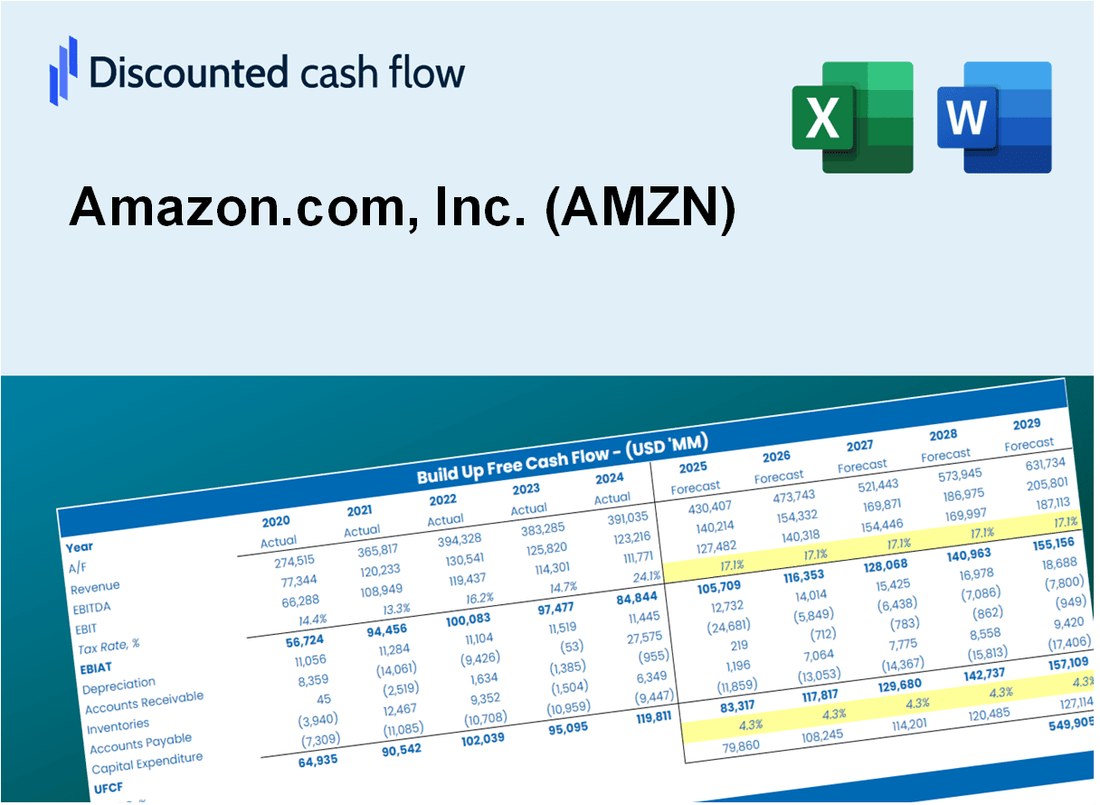
تم تصميم حاسبة DCF الخاصة بنا (AMZN) DCF الخاصة بنا ، بتقييم تقييم Amazon.com ، Inc. باستخدام البيانات المالية في العالم الحقيقي وتوفر مرونة كاملة لتعديل جميع المعلمات الأساسية للتوقعات المحسنة.
Discounted Cash Flow (DCF) - (USD MM)
| Year | AY1 2020 |
AY2 2021 |
AY3 2022 |
AY4 2023 |
AY5 2024 |
FY1 2025 |
FY2 2026 |
FY3 2027 |
FY4 2028 |
FY5 2029 |
|---|---|---|---|---|---|---|---|---|---|---|
| Revenue | 386,064.0 | 469,822.0 | 513,983.0 | 574,785.0 | 637,959.0 | 723,948.5 | 821,528.3 | 932,260.8 | 1,057,918.7 | 1,200,513.8 |
| Revenue Growth, % | 0 | 21.7 | 9.4 | 11.83 | 10.99 | 13.48 | 13.48 | 13.48 | 13.48 | 13.48 |
| EBITDA | 51,005.0 | 74,393.0 | 38,352.0 | 89,402.0 | 123,815.0 | 103,480.5 | 117,428.5 | 133,256.5 | 151,217.9 | 171,600.3 |
| EBITDA, % | 13.21 | 15.83 | 7.46 | 15.55 | 19.41 | 14.29 | 14.29 | 14.29 | 14.29 | 14.29 |
| Depreciation | 25,180.0 | 34,433.0 | 41,921.0 | 48,663.0 | 52,795.0 | 56,104.8 | 63,667.1 | 72,248.7 | 81,987.0 | 93,037.9 |
| Depreciation, % | 6.52 | 7.33 | 8.16 | 8.47 | 8.28 | 7.75 | 7.75 | 7.75 | 7.75 | 7.75 |
| EBIT | 25,825.0 | 39,960.0 | -3,569.0 | 40,739.0 | 71,020.0 | 47,375.7 | 53,761.4 | 61,007.8 | 69,230.9 | 78,562.4 |
| EBIT, % | 6.69 | 8.51 | -0.69438 | 7.09 | 11.13 | 6.54 | 6.54 | 6.54 | 6.54 | 6.54 |
| Total Cash | 84,396.0 | 96,049.0 | 70,026.0 | 86,780.0 | 101,202.0 | 125,807.4 | 142,764.7 | 162,007.8 | 183,844.5 | 208,624.6 |
| Total Cash, percent | .0 | .0 | .0 | .0 | .0 | .0 | .0 | .0 | .0 | .0 |
| Account Receivables | 24,542.0 | 32,891.0 | 42,360.0 | 52,253.0 | 55,451.0 | 57,021.1 | 64,706.9 | 73,428.7 | 83,326.0 | 94,557.4 |
| Account Receivables, % | 6.36 | 7 | 8.24 | 9.09 | 8.69 | 7.88 | 7.88 | 7.88 | 7.88 | 7.88 |
| Inventories | 23,795.0 | 32,640.0 | 34,405.0 | 33,318.0 | 34,214.0 | 44,833.0 | 50,876.0 | 57,733.5 | 65,515.3 | 74,346.0 |
| Inventories, % | 6.16 | 6.95 | 6.69 | 5.8 | 5.36 | 6.19 | 6.19 | 6.19 | 6.19 | 6.19 |
| Accounts Payable | 72,539.0 | 78,664.0 | 79,600.0 | 84,981.0 | 94,363.0 | 116,694.5 | 132,423.5 | 150,272.7 | 170,527.7 | 193,512.9 |
| Accounts Payable, % | 18.79 | 16.74 | 15.49 | 14.78 | 14.79 | 16.12 | 16.12 | 16.12 | 16.12 | 16.12 |
| Capital Expenditure | -40,140.0 | -61,053.0 | -63,645.0 | -52,729.0 | -82,999.0 | -83,918.1 | -95,229.3 | -108,065.1 | -122,631.1 | -139,160.3 |
| Capital Expenditure, % | -10.4 | -12.99 | -12.38 | -9.17 | -13.01 | -11.59 | -11.59 | -11.59 | -11.59 | -11.59 |
| Tax Rate, % | 13.52 | 13.52 | 13.52 | 13.52 | 13.52 | 13.52 | 13.52 | 13.52 | 13.52 | 13.52 |
| EBITAT | 22,769.0 | 34,946.0 | -1,636.6 | 33,002.7 | 61,416.0 | 36,854.7 | 41,822.3 | 47,459.4 | 53,856.4 | 61,115.6 |
| Depreciation | ||||||||||
| Changes in Account Receivables | ||||||||||
| Changes in Inventories | ||||||||||
| Changes in Accounts Payable | ||||||||||
| Capital Expenditure | ||||||||||
| UFCF | 32,011.0 | -2,743.0 | -33,658.6 | 25,511.7 | 36,500.0 | 19,183.7 | 12,260.4 | 13,912.9 | 15,788.2 | 17,916.3 |
| WACC, % | 9.86 | 9.85 | 9.78 | 9.84 | 9.85 | 9.84 | 9.84 | 9.84 | 9.84 | 9.84 |
| PV UFCF | ||||||||||
| SUM PV UFCF | 60,183.5 | |||||||||
| Long Term Growth Rate, % | 4.00 | |||||||||
| Free cash flow (T + 1) | 18,633 | |||||||||
| Terminal Value | 319,244 | |||||||||
| Present Terminal Value | 199,704 | |||||||||
| Enterprise Value | 259,888 | |||||||||
| Net Debt | 52,121 | |||||||||
| Equity Value | 207,767 | |||||||||
| Diluted Shares Outstanding, MM | 10,721 | |||||||||
| Equity Value Per Share | 19.38 |
What You Will Get
- Real Amazon Data: Preloaded financials – from revenue to EBIT – based on actual and projected figures for Amazon.com, Inc. (AMZN).
- Full Customization: Adjust all critical parameters (yellow cells) like WACC, growth %, and tax rates tailored for Amazon.com, Inc. (AMZN).
- Instant Valuation Updates: Automatic recalculations to analyze the impact of changes on Amazon.com, Inc. (AMZN)’s fair value.
- Versatile Excel Template: Designed for quick edits, scenario testing, and detailed projections specific to Amazon.com, Inc. (AMZN).
- Time-Saving and Accurate: Skip building models from scratch while ensuring precision and flexibility for Amazon.com, Inc. (AMZN).
Key Features
- Real-Life AMZN Data: Pre-filled with Amazon’s historical financials and forward-looking projections.
- Fully Customizable Inputs: Adjust revenue growth, margins, WACC, tax rates, and capital expenditures.
- Dynamic Valuation Model: Automatic updates to Net Present Value (NPV) and intrinsic value based on your inputs.
- Scenario Testing: Create multiple forecast scenarios to analyze different valuation outcomes.
- User-Friendly Design: Simple, structured, and designed for professionals and beginners alike.
How It Works
- Download the Template: Gain immediate access to the Excel-based AMZN DCF Calculator.
- Input Your Assumptions: Modify the yellow-highlighted cells for growth rates, WACC, margins, and more.
- Instant Calculations: The model automatically recalculates Amazon’s intrinsic value.
- Test Scenarios: Experiment with various assumptions to assess potential valuation shifts.
- Analyze and Decide: Utilize the outcomes to inform your investment or financial analysis.
Why Choose This Calculator for Amazon.com, Inc. (AMZN)?
- All-in-One Solution: Features DCF, WACC, and a variety of financial ratio analyses tailored for AMZN.
- Flexible Inputs: Modify the highlighted cells to explore different financial scenarios for Amazon.
- In-Depth Analysis: Automatically computes Amazon's intrinsic value and Net Present Value.
- Data-Rich Environment: Comes with historical and projected data for precise analysis.
- Expert-Level Utility: Perfect for financial analysts, investors, and business consultants focused on AMZN.
Who Should Use This Product?
- Professional Investors: Develop comprehensive and accurate valuation models for portfolio assessment of Amazon.com, Inc. (AMZN).
- Corporate Finance Teams: Evaluate valuation scenarios to inform strategic decisions within the organization.
- Consultants and Advisors: Deliver precise valuation insights for clients interested in Amazon.com, Inc. (AMZN).
- Students and Educators: Utilize real-time data to enhance learning and practice in financial modeling.
- Tech Enthusiasts: Gain insights into the valuation methodologies applied to tech giants like Amazon.com, Inc. (AMZN).
What the Template Contains
- Operating and Balance Sheet Data: Pre-filled Amazon.com, Inc. (AMZN) historical data and forecasts, including revenue, EBITDA, EBIT, and capital expenditures.
- WACC Calculation: A dedicated sheet for Weighted Average Cost of Capital (WACC), including parameters like Beta, risk-free rate, and share price.
- DCF Valuation (Unlevered and Levered): Editable Discounted Cash Flow models showing intrinsic value with detailed calculations.
- Financial Statements: Pre-loaded financial statements (annual and quarterly) to support analysis.
- Key Ratios: Includes profitability, leverage, and efficiency ratios for Amazon.com, Inc. (AMZN).
- Dashboard and Charts: Visual summary of valuation outputs and assumptions to analyze results easily.
Disclaimer
All information, articles, and product details provided on this website are for general informational and educational purposes only. We do not claim any ownership over, nor do we intend to infringe upon, any trademarks, copyrights, logos, brand names, or other intellectual property mentioned or depicted on this site. Such intellectual property remains the property of its respective owners, and any references here are made solely for identification or informational purposes, without implying any affiliation, endorsement, or partnership.
We make no representations or warranties, express or implied, regarding the accuracy, completeness, or suitability of any content or products presented. Nothing on this website should be construed as legal, tax, investment, financial, medical, or other professional advice. In addition, no part of this site—including articles or product references—constitutes a solicitation, recommendation, endorsement, advertisement, or offer to buy or sell any securities, franchises, or other financial instruments, particularly in jurisdictions where such activity would be unlawful.
All content is of a general nature and may not address the specific circumstances of any individual or entity. It is not a substitute for professional advice or services. Any actions you take based on the information provided here are strictly at your own risk. You accept full responsibility for any decisions or outcomes arising from your use of this website and agree to release us from any liability in connection with your use of, or reliance upon, the content or products found herein.