
|
Anika Therapeutics ، Inc. (ANIK) DCF تقييم |
Fully Editable: Tailor To Your Needs In Excel Or Sheets
Professional Design: Trusted, Industry-Standard Templates
Investor-Approved Valuation Models
MAC/PC Compatible, Fully Unlocked
No Expertise Is Needed; Easy To Follow
Anika Therapeutics, Inc. (ANIK) Bundle
سواء كنت مستثمرًا أو محللًا ، فإن حاسبة DCF (Anik) هذه هي موردك الأساسي للتقييم الدقيق. محملة بالبيانات الحقيقية من Anika Therapeutics ، Inc. ، يمكنك ضبط التوقعات ومراقبة التأثيرات في الوقت الفعلي.
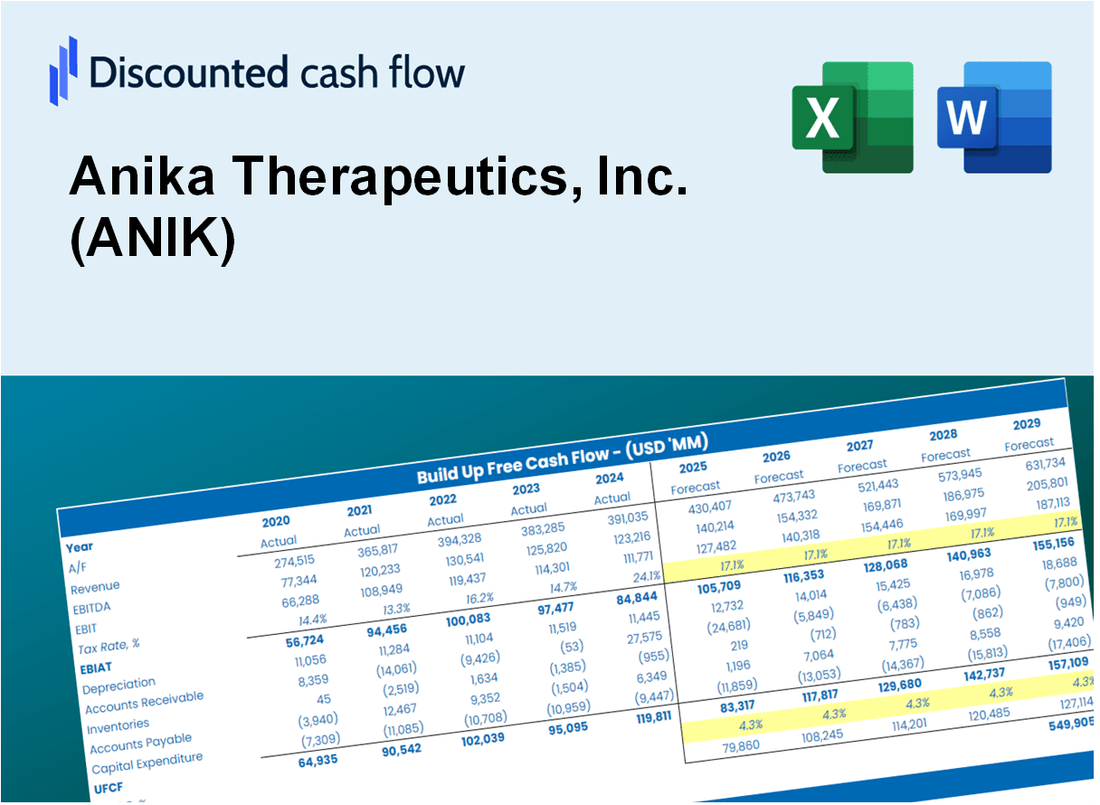
Discounted Cash Flow (DCF) - (USD MM)
| Year | AY1 2020 |
AY2 2021 |
AY3 2022 |
AY4 2023 |
AY5 2024 |
FY1 2025 |
FY2 2026 |
FY3 2027 |
FY4 2028 |
FY5 2029 |
|---|---|---|---|---|---|---|---|---|---|---|
| Revenue | 130.5 | 147.8 | 113.8 | 120.8 | 119.9 | 118.6 | 117.3 | 116.1 | 114.8 | 113.6 |
| Revenue Growth, % | 0 | 13.29 | -22.98 | 6.12 | -0.73266 | -1.08 | -1.08 | -1.08 | -1.08 | -1.08 |
| EBITDA | -1.0 | -4.2 | 18.2 | 15.1 | 3.0 | 6.5 | 6.4 | 6.3 | 6.3 | 6.2 |
| EBITDA, % | -0.7696 | -2.82 | 15.95 | 12.47 | 2.52 | 5.47 | 5.47 | 5.47 | 5.47 | 5.47 |
| Depreciation | 13.5 | 14.3 | 14.5 | 14.2 | 8.1 | 12.2 | 12.0 | 11.9 | 11.8 | 11.6 |
| Depreciation, % | 10.32 | 9.69 | 12.73 | 11.77 | 6.77 | 10.26 | 10.26 | 10.26 | 10.26 | 10.26 |
| EBIT | -14.5 | -18.5 | 3.7 | .8 | -5.1 | -5.7 | -5.6 | -5.6 | -5.5 | -5.4 |
| EBIT, % | -11.09 | -12.5 | 3.22 | 0.69872 | -4.25 | -4.79 | -4.79 | -4.79 | -4.79 | -4.79 |
| Total Cash | 98.3 | 94.4 | 86.3 | 68.7 | 55.6 | 75.5 | 74.7 | 73.9 | 73.1 | 72.3 |
| Total Cash, percent | .0 | .0 | .0 | .0 | .0 | .0 | .0 | .0 | .0 | .0 |
| Account Receivables | 24.1 | 29.8 | 34.6 | 26.4 | 23.6 | 26.2 | 26.0 | 25.7 | 25.4 | 25.1 |
| Account Receivables, % | 18.48 | 20.19 | 30.42 | 21.82 | 19.68 | 22.12 | 22.12 | 22.12 | 22.12 | 22.12 |
| Inventories | 46.2 | 36.0 | 39.8 | 24.4 | 23.8 | 32.0 | 31.6 | 31.3 | 31.0 | 30.6 |
| Inventories, % | 35.42 | 24.36 | 34.93 | 20.22 | 19.86 | 26.96 | 26.96 | 26.96 | 26.96 | 26.96 |
| Accounts Payable | 9.0 | 7.6 | 9.1 | 6.2 | 5.6 | 7.1 | 7.0 | 6.9 | 6.9 | 6.8 |
| Accounts Payable, % | 6.89 | 5.16 | 7.97 | 5.13 | 4.68 | 5.97 | 5.97 | 5.97 | 5.97 | 5.97 |
| Capital Expenditure | -1.6 | -5.1 | -7.5 | -5.4 | -7.7 | -5.3 | -5.2 | -5.2 | -5.1 | -5.1 |
| Capital Expenditure, % | -1.25 | -3.48 | -6.58 | -4.49 | -6.45 | -4.45 | -4.45 | -4.45 | -4.45 | -4.45 |
| Tax Rate, % | -1939.98 | -1939.98 | -1939.98 | -1939.98 | -1939.98 | -1939.98 | -1939.98 | -1939.98 | -1939.98 | -1939.98 |
| EBITAT | -12.1 | -31.5 | -12.6 | -22.1 | -104.1 | -3.2 | -3.2 | -3.2 | -3.1 | -3.1 |
| Depreciation | ||||||||||
| Changes in Account Receivables | ||||||||||
| Changes in Inventories | ||||||||||
| Changes in Accounts Payable | ||||||||||
| Capital Expenditure | ||||||||||
| UFCF | -61.6 | -19.2 | -12.7 | 7.4 | -100.9 | -5.7 | 4.2 | 4.1 | 4.1 | 4.0 |
| WACC, % | 5.7 | 5.79 | 5.23 | 5.23 | 5.79 | 5.55 | 5.55 | 5.55 | 5.55 | 5.55 |
| PV UFCF | ||||||||||
| SUM PV UFCF | 8.3 | |||||||||
| Long Term Growth Rate, % | 2.00 | |||||||||
| Free cash flow (T + 1) | 4 | |||||||||
| Terminal Value | 116 | |||||||||
| Present Terminal Value | 89 | |||||||||
| Enterprise Value | 97 | |||||||||
| Net Debt | -30 | |||||||||
| Equity Value | 127 | |||||||||
| Diluted Shares Outstanding, MM | 15 | |||||||||
| Equity Value Per Share | 8.60 |
What You Will Get
- Editable Forecast Inputs: Easily modify key assumptions (growth %, margins, WACC) to explore various scenarios.
- Real-World Data: Anika Therapeutics’ financial data pre-filled to kickstart your analysis.
- Automatic DCF Outputs: The template computes Net Present Value (NPV) and intrinsic value automatically.
- Customizable and Professional: A refined Excel model designed to meet your valuation requirements.
- Built for Analysts and Investors: Perfect for evaluating projections, confirming strategies, and enhancing efficiency.
Key Features
- Comprehensive Data Access: Anika Therapeutics’ historical financial statements and projected forecasts.
- Customizable Parameters: Modify WACC, tax rates, revenue growth, and EBITDA margins as needed.
- Real-Time Insights: View Anika Therapeutics’ intrinsic value update instantly.
- Intuitive Visualizations: Dashboard graphs illustrate valuation outcomes and essential metrics.
- Designed for Precision: A reliable tool for analysts, investors, and finance professionals.
How It Works
- Step 1: Download the prebuilt Excel template featuring Anika Therapeutics, Inc. (ANIK) data.
- Step 2: Review the pre-filled sheets to grasp the essential metrics.
- Step 3: Modify forecasts and assumptions in the editable yellow cells (WACC, growth, margins).
- Step 4: Instantly see recalculated results, including Anika Therapeutics, Inc. (ANIK)'s intrinsic value.
- Step 5: Make well-informed investment decisions or create reports using the generated outputs.
Why Choose Anika Therapeutics, Inc. (ANIK) Calculator?
- Comprehensive Tool: Features DCF, WACC, and financial ratio analyses tailored for biotech companies.
- Customizable Inputs: Modify yellow-highlighted cells to explore different financial scenarios.
- Detailed Insights: Automatically computes Anika’s intrinsic value and Net Present Value.
- Preloaded Data: Contains historical and projected data for precise analysis.
- Professional Quality: Perfect for biotech analysts, investors, and healthcare consultants.
Who Should Use This Product?
- Investors: Accurately assess Anika Therapeutics’ fair value before making investment choices.
- CFOs: Utilize a professional-grade DCF model for financial analysis and reporting.
- Consultants: Easily modify the template for valuation reports tailored to clients.
- Entrepreneurs: Obtain insights into financial modeling practices employed by leading biotech firms.
- Educators: Employ it as a teaching resource to illustrate valuation techniques.
What the Template Contains
- Pre-Filled Data: Includes Anika Therapeutics’ historical financials and forecasts.
- Discounted Cash Flow Model: Editable DCF valuation model with automatic calculations.
- Weighted Average Cost of Capital (WACC): A dedicated sheet for calculating WACC based on custom inputs.
- Key Financial Ratios: Analyze Anika Therapeutics’ profitability, efficiency, and leverage.
- Customizable Inputs: Edit revenue growth, margins, and tax rates with ease.
- Clear Dashboard: Charts and tables summarizing key valuation results.
Disclaimer
All information, articles, and product details provided on this website are for general informational and educational purposes only. We do not claim any ownership over, nor do we intend to infringe upon, any trademarks, copyrights, logos, brand names, or other intellectual property mentioned or depicted on this site. Such intellectual property remains the property of its respective owners, and any references here are made solely for identification or informational purposes, without implying any affiliation, endorsement, or partnership.
We make no representations or warranties, express or implied, regarding the accuracy, completeness, or suitability of any content or products presented. Nothing on this website should be construed as legal, tax, investment, financial, medical, or other professional advice. In addition, no part of this site—including articles or product references—constitutes a solicitation, recommendation, endorsement, advertisement, or offer to buy or sell any securities, franchises, or other financial instruments, particularly in jurisdictions where such activity would be unlawful.
All content is of a general nature and may not address the specific circumstances of any individual or entity. It is not a substitute for professional advice or services. Any actions you take based on the information provided here are strictly at your own risk. You accept full responsibility for any decisions or outcomes arising from your use of this website and agree to release us from any liability in connection with your use of, or reliance upon, the content or products found herein.