|
Sphere 3D Corp. (أي) تقييم DCF |
Fully Editable: Tailor To Your Needs In Excel Or Sheets
Professional Design: Trusted, Industry-Standard Templates
Investor-Approved Valuation Models
MAC/PC Compatible, Fully Unlocked
No Expertise Is Needed; Easy To Follow
Sphere 3D Corp. (ANY) Bundle
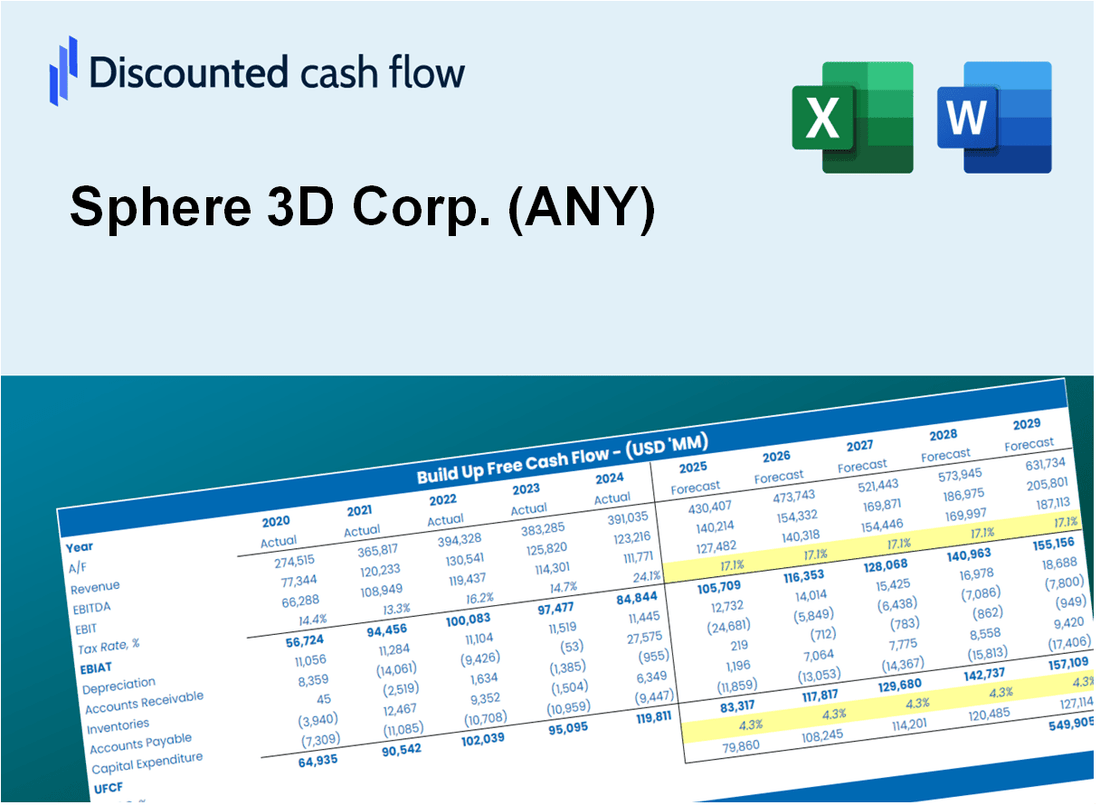
احصل على نظرة ثاقبة في تحليل التقييم الخاص بك 3D Corp. (أي) باستخدام حاسبة DCF المتقدمة! يأتي قالب Excel هذا مسبقًا مع بيانات حقيقية لـ (أي) ، مما يتيح لك ضبط التوقعات والافتراضات لتحديد القيمة الجوهرية لـ Sphere 3D Corp بدقة.
Discounted Cash Flow (DCF) - (USD MM)
| Year | AY1 2020 |
AY2 2021 |
AY3 2022 |
AY4 2023 |
AY5 2024 |
FY1 2025 |
FY2 2026 |
FY3 2027 |
FY4 2028 |
FY5 2029 |
|---|---|---|---|---|---|---|---|---|---|---|
| Revenue | 4.8 | 3.7 | 6.1 | 21.9 | 16.6 | 21.4 | 27.6 | 35.6 | 46.0 | 59.3 |
| Revenue Growth, % | 0 | -23.27 | 63.36 | 260.47 | -24.19 | 28.98 | 28.98 | 28.98 | 28.98 | 28.98 |
| EBITDA | -4.1 | -11.1 | -164.5 | -15.9 | -2.2 | -15.9 | -20.5 | -26.4 | -34.0 | -43.9 |
| EBITDA, % | -84.08 | -298.47 | -2706.65 | -72.78 | -13.29 | -74.03 | -74.03 | -74.03 | -74.03 | -74.03 |
| Depreciation | 1.0 | 5.7 | 28.3 | 6.2 | 7.1 | 12.5 | 16.1 | 20.7 | 26.8 | 34.5 |
| Depreciation, % | 20.03 | 152.82 | 465.08 | 28.26 | 42.83 | 58.22 | 58.22 | 58.22 | 58.22 | 58.22 |
| EBIT | -5.0 | -16.8 | -192.7 | -22.1 | -9.3 | -19.5 | -25.2 | -32.5 | -41.9 | -54.1 |
| EBIT, % | -104.1 | -451.29 | -3171.73 | -101.04 | -56.12 | -91.22 | -91.22 | -91.22 | -91.22 | -91.22 |
| Total Cash | .5 | 54.4 | 1.3 | 1.6 | 13.0 | 9.3 | 12.0 | 15.4 | 19.9 | 25.7 |
| Total Cash, percent | .0 | .0 | .0 | .0 | .0 | .0 | .0 | .0 | .0 | .0 |
| Account Receivables | .3 | 2.0 | 4.0 | .0 | .0 | 5.4 | 7.0 | 9.0 | 11.6 | 14.9 |
| Account Receivables, % | 5.45 | 54.84 | 65.74 | 0 | 0 | 25.2 | 25.2 | 25.2 | 25.2 | 25.2 |
| Inventories | .6 | .0 | .0 | .0 | .0 | .5 | .6 | .8 | 1.1 | 1.4 |
| Inventories, % | 11.51 | 0 | 0 | 0 | 0 | 2.3 | 2.3 | 2.3 | 2.3 | 2.3 |
| Accounts Payable | 2.0 | 1.3 | 3.0 | 2.4 | 1.2 | 6.1 | 7.8 | 10.1 | 13.0 | 16.8 |
| Accounts Payable, % | 40.76 | 33.66 | 49.25 | 10.84 | 7.03 | 28.31 | 28.31 | 28.31 | 28.31 | 28.31 |
| Capital Expenditure | .0 | -102.2 | -17.9 | -1.6 | -8.9 | -11.2 | -14.4 | -18.6 | -24.0 | -30.9 |
| Capital Expenditure, % | 0 | -2748.33 | -295.16 | -7.13 | -53.85 | -52.2 | -52.2 | -52.2 | -52.2 | -52.2 |
| Tax Rate, % | -1.61 | -1.61 | -1.61 | -1.61 | -1.61 | -1.61 | -1.61 | -1.61 | -1.61 | -1.61 |
| EBITAT | -5.1 | -16.8 | -192.8 | -22.2 | -9.5 | -19.5 | -25.2 | -32.5 | -41.9 | -54.1 |
| Depreciation | ||||||||||
| Changes in Account Receivables | ||||||||||
| Changes in Inventories | ||||||||||
| Changes in Accounts Payable | ||||||||||
| Capital Expenditure | ||||||||||
| UFCF | -2.9 | -115.3 | -182.7 | -14.2 | -12.5 | -19.2 | -23.5 | -30.3 | -39.1 | -50.4 |
| WACC, % | 20.43 | 20.43 | 20.43 | 20.43 | 20.43 | 20.43 | 20.43 | 20.43 | 20.43 | 20.43 |
| PV UFCF | ||||||||||
| SUM PV UFCF | -88.0 | |||||||||
| Long Term Growth Rate, % | 2.00 | |||||||||
| Free cash flow (T + 1) | -51 | |||||||||
| Terminal Value | -279 | |||||||||
| Present Terminal Value | -110 | |||||||||
| Enterprise Value | -198 | |||||||||
| Net Debt | -5 | |||||||||
| Equity Value | -193 | |||||||||
| Diluted Shares Outstanding, MM | 20 | |||||||||
| Equity Value Per Share | -9.72 |
What You Will Get
- Real ANY Financials: Access to both historical and projected data for precise valuation.
- Customizable Inputs: Adjust parameters like WACC, tax rates, revenue growth, and capital expenditures.
- Dynamic Calculations: Intrinsic value and NPV are computed in real-time.
- Scenario Analysis: Evaluate various scenarios to assess Sphere 3D Corp.'s future performance.
- User-Friendly Design: Designed for professionals while remaining approachable for newcomers.
Key Features
- Comprehensive DCF Calculator: Features detailed unlevered and levered DCF valuation models tailored for Sphere 3D Corp. (ANY).
- WACC Calculator: Pre-configured Weighted Average Cost of Capital sheet with adjustable inputs specific to Sphere 3D Corp. (ANY).
- Customizable Forecast Assumptions: Adjust growth rates, capital expenditures, and discount rates for accurate projections.
- Integrated Financial Ratios: Evaluate profitability, leverage, and efficiency ratios relevant to Sphere 3D Corp. (ANY).
- Interactive Dashboard and Charts: Visual representations highlight essential valuation metrics for straightforward analysis.
How It Works
- 1. Access the Template: Download and open the Excel file containing Sphere 3D Corp.'s (ANY) relevant data.
- 2. Adjust Assumptions: Modify essential inputs such as growth projections, WACC, and capital expenditures.
- 3. View Results Instantly: The DCF model automatically computes intrinsic value and NPV based on your inputs.
- 4. Explore Scenarios: Analyze various forecasts to evaluate different valuation possibilities.
- 5. Present with Assurance: Deliver expert valuation findings to aid in your decision-making process.
Why Choose Sphere 3D Corp. (ANY) Calculator?
- Accuracy: Leverages real Sphere 3D financial data to ensure precision.
- Flexibility: Allows users to easily test and adjust inputs as needed.
- Time-Saving: Eliminate the need to create a financial model from the ground up.
- Professional-Grade: Crafted with the expertise and usability expected at the CFO level.
- User-Friendly: Intuitive interface suitable for users with varying levels of financial modeling knowledge.
Who Should Use Sphere 3D Corp. (ANY)?
- Tech Enthusiasts: Discover innovative technologies and their applications in the digital landscape.
- Researchers: Utilize advanced data modeling techniques for in-depth analysis of cloud computing trends.
- Investors: Evaluate your investment strategies and assess the market potential of Sphere 3D Corp. (ANY).
- Analysts: Enhance your analysis with a customizable financial model tailored for the tech sector.
- Small Business Owners: Learn from Sphere 3D Corp.'s (ANY) approach to scaling and innovation in technology.
What the Template Contains
- Pre-Filled DCF Model: Sphere 3D Corp.’s (ANY) financial data preloaded for immediate use.
- WACC Calculator: Detailed calculations for Weighted Average Cost of Capital specific to Sphere 3D Corp. (ANY).
- Financial Ratios: Assess Sphere 3D Corp.’s (ANY) profitability, leverage, and efficiency metrics.
- Editable Inputs: Modify assumptions such as growth, margins, and CAPEX to align with your scenarios for Sphere 3D Corp. (ANY).
- Financial Statements: Annual and quarterly reports for Sphere 3D Corp. (ANY) to facilitate comprehensive analysis.
- Interactive Dashboard: Visualize key valuation metrics and results for Sphere 3D Corp. (ANY) with ease.
Disclaimer
All information, articles, and product details provided on this website are for general informational and educational purposes only. We do not claim any ownership over, nor do we intend to infringe upon, any trademarks, copyrights, logos, brand names, or other intellectual property mentioned or depicted on this site. Such intellectual property remains the property of its respective owners, and any references here are made solely for identification or informational purposes, without implying any affiliation, endorsement, or partnership.
We make no representations or warranties, express or implied, regarding the accuracy, completeness, or suitability of any content or products presented. Nothing on this website should be construed as legal, tax, investment, financial, medical, or other professional advice. In addition, no part of this site—including articles or product references—constitutes a solicitation, recommendation, endorsement, advertisement, or offer to buy or sell any securities, franchises, or other financial instruments, particularly in jurisdictions where such activity would be unlawful.
All content is of a general nature and may not address the specific circumstances of any individual or entity. It is not a substitute for professional advice or services. Any actions you take based on the information provided here are strictly at your own risk. You accept full responsibility for any decisions or outcomes arising from your use of this website and agree to release us from any liability in connection with your use of, or reliance upon, the content or products found herein.