
|
Arch Resources ، Inc. (ARCH) DCF تقييم |
Fully Editable: Tailor To Your Needs In Excel Or Sheets
Professional Design: Trusted, Industry-Standard Templates
Investor-Approved Valuation Models
MAC/PC Compatible, Fully Unlocked
No Expertise Is Needed; Easy To Follow
Arch Resources, Inc. (ARCH) Bundle
تقييم التوقعات المالية لـ Arch Resources ، Inc. مثل خبير! توفر لك حاسبة DCF (ARCH) هذه البيانات المالية المليئة مسبقًا والمرونة لتعديل نمو الإيرادات ، WACC ، الهوامش ، وغيرها من الافتراضات الحرجة التي تتماشى مع توقعاتك.
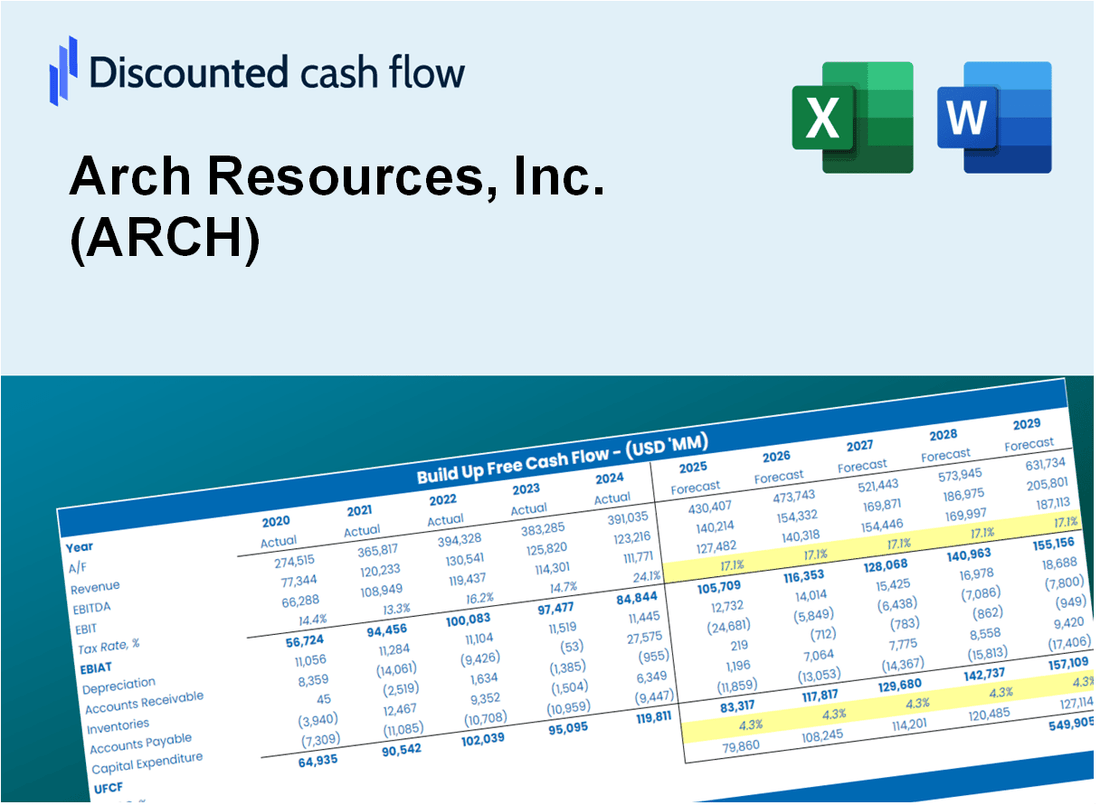
Discounted Cash Flow (DCF) - (USD MM)
| Year | AY1 2019 |
AY2 2020 |
AY3 2021 |
AY4 2022 |
AY5 2023 |
FY1 2024 |
FY2 2025 |
FY3 2026 |
FY4 2027 |
FY5 2028 |
|---|---|---|---|---|---|---|---|---|---|---|
| Revenue | 2,294.4 | 1,467.6 | 2,208.0 | 3,724.6 | 3,145.8 | 3,677.2 | 4,298.3 | 5,024.3 | 5,873.0 | 6,865.0 |
| Revenue Growth, % | 0 | -36.03 | 50.45 | 68.68 | -15.54 | 16.89 | 16.89 | 16.89 | 16.89 | 16.89 |
| EBITDA | 383.8 | -190.9 | 503.6 | 1,250.4 | 734.0 | 613.6 | 717.2 | 838.3 | 979.9 | 1,145.4 |
| EBITDA, % | 16.73 | -13.01 | 22.81 | 33.57 | 23.33 | 16.69 | 16.69 | 16.69 | 16.69 | 16.69 |
| Depreciation | 132.2 | 141.4 | 142.1 | 151.0 | 167.6 | 229.6 | 268.3 | 313.7 | 366.6 | 428.6 |
| Depreciation, % | 5.76 | 9.64 | 6.43 | 4.05 | 5.33 | 6.24 | 6.24 | 6.24 | 6.24 | 6.24 |
| EBIT | 251.6 | -332.3 | 361.5 | 1,099.3 | 566.4 | 384.0 | 448.8 | 524.7 | 613.3 | 716.9 |
| EBIT, % | 10.97 | -22.64 | 16.37 | 29.52 | 18 | 10.44 | 10.44 | 10.44 | 10.44 | 10.44 |
| Total Cash | 288.7 | 284.3 | 339.7 | 273.1 | 320.5 | 477.0 | 557.5 | 651.7 | 761.8 | 890.4 |
| Total Cash, percent | .0 | .0 | .0 | .0 | .0 | .0 | .0 | .0 | .0 | .0 |
| Account Receivables | 189.3 | 113.9 | 332.6 | 255.3 | 287.2 | 346.1 | 404.5 | 472.9 | 552.7 | 646.1 |
| Account Receivables, % | 8.25 | 7.76 | 15.06 | 6.85 | 9.13 | 9.41 | 9.41 | 9.41 | 9.41 | 9.41 |
| Inventories | 130.9 | 126.0 | 156.7 | 223.0 | 244.3 | 258.4 | 302.1 | 353.1 | 412.8 | 482.5 |
| Inventories, % | 5.71 | 8.59 | 7.1 | 5.99 | 7.76 | 7.03 | 7.03 | 7.03 | 7.03 | 7.03 |
| Accounts Payable | 133.1 | 103.7 | 70.4 | 211.8 | 205.0 | 207.8 | 243.0 | 284.0 | 332.0 | 388.0 |
| Accounts Payable, % | 5.8 | 7.07 | 3.19 | 5.69 | 6.52 | 5.65 | 5.65 | 5.65 | 5.65 | 5.65 |
| Capital Expenditure | -267.6 | -287.1 | -246.6 | -173.8 | -176.0 | -387.3 | -452.7 | -529.1 | -618.5 | -723.0 |
| Capital Expenditure, % | -11.66 | -19.56 | -11.17 | -4.67 | -5.6 | -10.53 | -10.53 | -10.53 | -10.53 | -10.53 |
| Tax Rate, % | 15.87 | 15.87 | 15.87 | 15.87 | 15.87 | 15.87 | 15.87 | 15.87 | 15.87 | 15.87 |
| EBITAT | 251.3 | -332.3 | 359.5 | 1,356.0 | 476.5 | 371.3 | 434.0 | 507.3 | 593.0 | 693.2 |
| Depreciation | ||||||||||
| Changes in Account Receivables | ||||||||||
| Changes in Inventories | ||||||||||
| Changes in Accounts Payable | ||||||||||
| Capital Expenditure | ||||||||||
| UFCF | -71.2 | -427.0 | -27.8 | 1,485.7 | 408.0 | 143.4 | 182.7 | 213.5 | 249.6 | 291.8 |
| WACC, % | 7.46 | 7.46 | 7.46 | 7.46 | 7.38 | 7.44 | 7.44 | 7.44 | 7.44 | 7.44 |
| PV UFCF | ||||||||||
| SUM PV UFCF | 855.0 | |||||||||
| Long Term Growth Rate, % | 0.50 | |||||||||
| Free cash flow (T + 1) | 293 | |||||||||
| Terminal Value | 4,223 | |||||||||
| Present Terminal Value | 2,949 | |||||||||
| Enterprise Value | 3,804 | |||||||||
| Net Debt | -135 | |||||||||
| Equity Value | 3,939 | |||||||||
| Diluted Shares Outstanding, MM | 19 | |||||||||
| Equity Value Per Share | 205.35 |
What You Will Get
- Real Arch Resources Data: Preloaded financials – from revenue to EBIT – based on actual and projected figures for Arch Resources, Inc. (ARCH).
- Full Customization: Adjust all critical parameters (yellow cells) like WACC, growth %, and tax rates specific to Arch Resources, Inc. (ARCH).
- Instant Valuation Updates: Automatic recalculations to analyze the impact of changes on Arch Resources, Inc.'s (ARCH) fair value.
- Versatile Excel Template: Tailored for quick edits, scenario testing, and detailed projections relevant to Arch Resources, Inc. (ARCH).
- Time-Saving and Accurate: Skip building models from scratch while maintaining precision and flexibility for Arch Resources, Inc. (ARCH).
Key Features
- Customizable Forecast Inputs: Adjust essential metrics such as production levels, cost per ton, and capital investments.
- Instant DCF Valuation: Quickly computes intrinsic value, NPV, and additional financial metrics.
- High-Precision Accuracy: Leverages Arch Resources' actual financial data for credible valuation results.
- Simplified Scenario Analysis: Easily evaluate various assumptions and analyze different outcomes.
- Efficiency Booster: Remove the hassle of creating intricate valuation models from the ground up.
How It Works
- Step 1: Download the prebuilt Excel template featuring Arch Resources, Inc. (ARCH) data.
- Step 2: Navigate through the pre-filled sheets to familiarize yourself with the key metrics.
- Step 3: Modify the forecasts and assumptions in the editable yellow cells (WACC, growth, margins).
- Step 4: Instantly see the recalculated results, including Arch Resources, Inc.'s (ARCH) intrinsic value.
- Step 5: Utilize the outputs to make informed investment decisions or create reports.
Why Choose This Calculator for Arch Resources, Inc. (ARCH)?
- Designed for Experts: A sophisticated tool utilized by financial analysts, CFOs, and industry consultants.
- Accurate Data: Arch Resources’ historical and forecasted financials are preloaded for precise calculations.
- Forecast Scenarios: Effortlessly simulate various forecasts and assumptions.
- Comprehensive Outputs: Automatically computes intrinsic value, NPV, and essential financial metrics.
- User-Friendly: Step-by-step guidance ensures a smooth calculation process.
Who Should Use This Product?
- Investors: Accurately assess Arch Resources, Inc.'s (ARCH) fair value prior to making investment choices.
- CFOs: Utilize a professional-grade DCF model for comprehensive financial reporting and analysis related to Arch Resources, Inc. (ARCH).
- Consultants: Efficiently customize the template for valuation reports tailored to Arch Resources, Inc. (ARCH) clients.
- Entrepreneurs: Acquire insights into the financial modeling practices employed by leading companies like Arch Resources, Inc. (ARCH).
- Educators: Implement it as a teaching resource to illustrate valuation methodologies relevant to Arch Resources, Inc. (ARCH).
What the Template Contains
- Comprehensive DCF Model: Editable template featuring detailed valuation calculations for Arch Resources, Inc. (ARCH).
- Real-World Data: Arch Resources’ historical and projected financials preloaded for in-depth analysis.
- Customizable Parameters: Modify WACC, growth rates, and tax assumptions to explore various scenarios.
- Financial Statements: Complete annual and quarterly breakdowns for enhanced insights into performance.
- Key Ratios: Integrated analysis for profitability, efficiency, and leverage metrics.
- Dashboard with Visual Outputs: Visualizations including charts and tables for clear, actionable results.
Disclaimer
All information, articles, and product details provided on this website are for general informational and educational purposes only. We do not claim any ownership over, nor do we intend to infringe upon, any trademarks, copyrights, logos, brand names, or other intellectual property mentioned or depicted on this site. Such intellectual property remains the property of its respective owners, and any references here are made solely for identification or informational purposes, without implying any affiliation, endorsement, or partnership.
We make no representations or warranties, express or implied, regarding the accuracy, completeness, or suitability of any content or products presented. Nothing on this website should be construed as legal, tax, investment, financial, medical, or other professional advice. In addition, no part of this site—including articles or product references—constitutes a solicitation, recommendation, endorsement, advertisement, or offer to buy or sell any securities, franchises, or other financial instruments, particularly in jurisdictions where such activity would be unlawful.
All content is of a general nature and may not address the specific circumstances of any individual or entity. It is not a substitute for professional advice or services. Any actions you take based on the information provided here are strictly at your own risk. You accept full responsibility for any decisions or outcomes arising from your use of this website and agree to release us from any liability in connection with your use of, or reliance upon, the content or products found herein.