
|
Archrock ، Inc. (AROC) تقييم DCF |
Fully Editable: Tailor To Your Needs In Excel Or Sheets
Professional Design: Trusted, Industry-Standard Templates
Investor-Approved Valuation Models
MAC/PC Compatible, Fully Unlocked
No Expertise Is Needed; Easy To Follow
Archrock, Inc. (AROC) Bundle
اكتشف الإمكانات الحقيقية لـ Archrock ، Inc. (AROC) مع حاسبة DCF المتقدمة! اضبط الافتراضات الرئيسية واستكشاف السيناريوهات المختلفة وتقييم كيفية تأثير التغييرات على تقييم Archrock ، Inc. (AROC) - كل ذلك ضمن قالب Excel واحد مناسب.
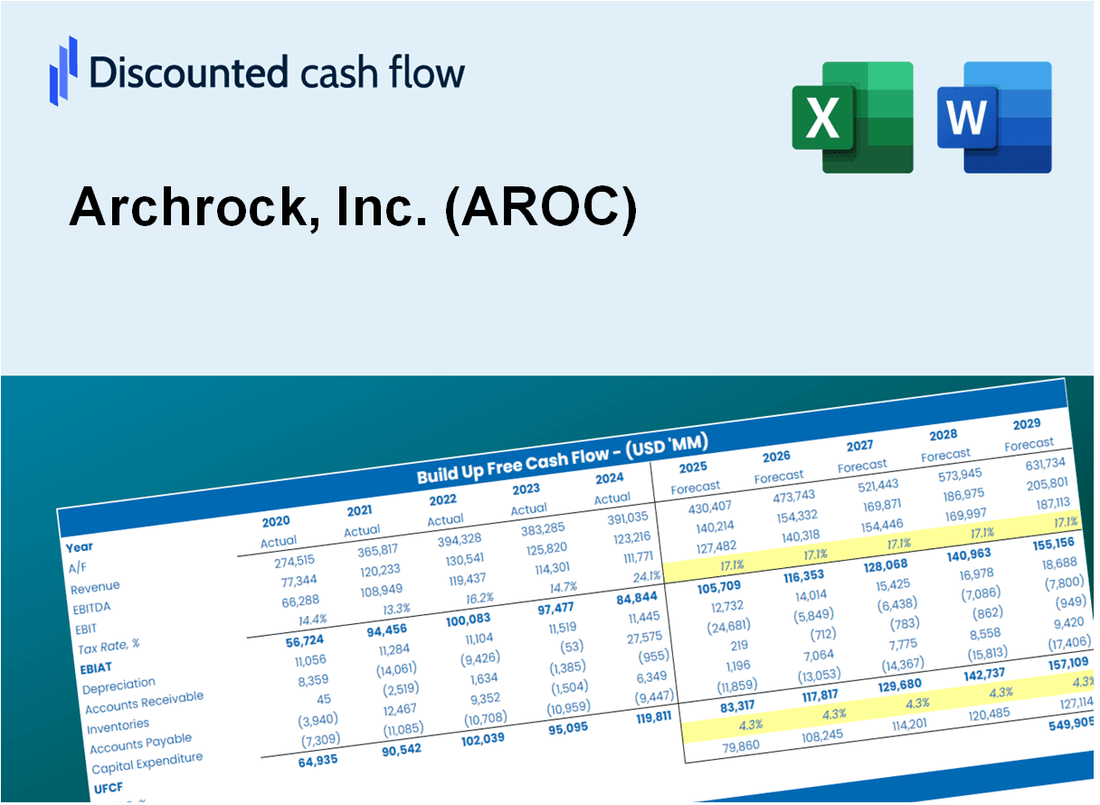
Discounted Cash Flow (DCF) - (USD MM)
| Year | AY1 2020 |
AY2 2021 |
AY3 2022 |
AY4 2023 |
AY5 2024 |
FY1 2025 |
FY2 2026 |
FY3 2027 |
FY4 2028 |
FY5 2029 |
|---|---|---|---|---|---|---|---|---|---|---|
| Revenue | 875.0 | 781.5 | 845.6 | 990.3 | 1,157.6 | 1,248.8 | 1,347.3 | 1,453.4 | 1,568.0 | 1,691.6 |
| Revenue Growth, % | 0 | -10.69 | 8.2 | 17.12 | 16.89 | 7.88 | 7.88 | 7.88 | 7.88 | 7.88 |
| EBITDA | 392.7 | 315.4 | 308.9 | 424.7 | 560.0 | 532.1 | 574.0 | 619.2 | 668.0 | 720.7 |
| EBITDA, % | 44.88 | 40.36 | 36.53 | 42.88 | 48.37 | 42.6 | 42.6 | 42.6 | 42.6 | 42.6 |
| Depreciation | 193.1 | 178.9 | 164.3 | 166.2 | 193.2 | 244.5 | 263.7 | 284.5 | 306.9 | 331.1 |
| Depreciation, % | 22.07 | 22.9 | 19.43 | 16.79 | 16.69 | 19.57 | 19.57 | 19.57 | 19.57 | 19.57 |
| EBIT | 199.5 | 136.4 | 144.6 | 258.4 | 366.8 | 287.6 | 310.3 | 334.7 | 361.1 | 389.6 |
| EBIT, % | 22.81 | 17.46 | 17.11 | 26.1 | 31.68 | 23.03 | 23.03 | 23.03 | 23.03 | 23.03 |
| Total Cash | 1.1 | 1.6 | 1.6 | 1.3 | 4.4 | 2.6 | 2.8 | 3.0 | 3.2 | 3.5 |
| Total Cash, percent | .0 | .0 | .0 | .0 | .0 | .0 | .0 | .0 | .0 | .0 |
| Account Receivables | 104.4 | 104.9 | 137.5 | 124.1 | 132.5 | 163.8 | 176.8 | 190.7 | 205.7 | 221.9 |
| Account Receivables, % | 11.93 | 13.43 | 16.27 | 12.53 | 11.44 | 13.12 | 13.12 | 13.12 | 13.12 | 13.12 |
| Inventories | 63.7 | 72.9 | 84.6 | 81.8 | 89.7 | 106.4 | 114.8 | 123.9 | 133.6 | 144.2 |
| Inventories, % | 7.28 | 9.32 | 10.01 | 8.26 | 7.75 | 8.52 | 8.52 | 8.52 | 8.52 | 8.52 |
| Accounts Payable | 30.8 | 38.9 | 64.3 | 61.0 | 57.6 | 68.0 | 73.4 | 79.2 | 85.4 | 92.2 |
| Accounts Payable, % | 3.52 | 4.98 | 7.61 | 6.16 | 4.97 | 5.45 | 5.45 | 5.45 | 5.45 | 5.45 |
| Capital Expenditure | -140.3 | -97.9 | -239.9 | -298.6 | -359.0 | -295.0 | -318.2 | -343.3 | -370.4 | -399.5 |
| Capital Expenditure, % | -16.04 | -12.53 | -28.37 | -30.15 | -31.02 | -23.62 | -23.62 | -23.62 | -23.62 | -23.62 |
| Tax Rate, % | 25.88 | 25.88 | 25.88 | 25.88 | 25.88 | 25.88 | 25.88 | 25.88 | 25.88 | 25.88 |
| EBITAT | 158.8 | 98.8 | 105.7 | 190.8 | 271.8 | 214.6 | 231.5 | 249.7 | 269.4 | 290.7 |
| Depreciation | ||||||||||
| Changes in Account Receivables | ||||||||||
| Changes in Inventories | ||||||||||
| Changes in Accounts Payable | ||||||||||
| Capital Expenditure | ||||||||||
| UFCF | 74.4 | 178.3 | 11.2 | 71.4 | 86.2 | 126.4 | 161.1 | 173.8 | 187.5 | 202.2 |
| WACC, % | 6.81 | 6.67 | 6.68 | 6.69 | 6.7 | 6.71 | 6.71 | 6.71 | 6.71 | 6.71 |
| PV UFCF | ||||||||||
| SUM PV UFCF | 693.7 | |||||||||
| Long Term Growth Rate, % | 4.00 | |||||||||
| Free cash flow (T + 1) | 210 | |||||||||
| Terminal Value | 7,763 | |||||||||
| Present Terminal Value | 5,610 | |||||||||
| Enterprise Value | 6,304 | |||||||||
| Net Debt | 2,206 | |||||||||
| Equity Value | 4,098 | |||||||||
| Diluted Shares Outstanding, MM | 162 | |||||||||
| Equity Value Per Share | 25.24 |
What You Will Get
- Real AROC Financials: Access to both historical and projected data for precise valuation.
- Customizable Inputs: Adjust WACC, tax rates, revenue growth, and capital expenditures as needed.
- Dynamic Calculations: Intrinsic value and NPV are computed automatically.
- Scenario Analysis: Evaluate various scenarios to assess Archrock's future performance.
- User-Friendly Design: Designed for professionals while remaining approachable for newcomers.
Key Features
- 🔍 Real-Life AROC Financials: Pre-filled historical and projected data for Archrock, Inc. (AROC).
- ✏️ Fully Customizable Inputs: Adjust all critical parameters (yellow cells) like WACC, growth %, and tax rates.
- 📊 Professional DCF Valuation: Built-in formulas calculate Archrock’s intrinsic value using the Discounted Cash Flow method.
- ⚡ Instant Results: Visualize Archrock’s valuation instantly after making changes.
- Scenario Analysis: Test and compare outcomes for various financial assumptions side-by-side.
How It Works
- Step 1: Download the Excel file.
- Step 2: Review pre-entered Archrock, Inc. (AROC) data (historical and projected).
- Step 3: Adjust key assumptions (yellow cells) based on your analysis.
- Step 4: View automatic recalculations for Archrock, Inc. (AROC)’s intrinsic value.
- Step 5: Use the outputs for investment decisions or reporting.
Why Choose Archrock, Inc. (AROC)?
- Efficient Solutions: Benefit from pre-built models that eliminate the need for extensive setup.
- Enhanced Reliability: Access to accurate data and methodologies minimizes valuation discrepancies.
- Completely Adaptable: Modify the model to align with your specific assumptions and forecasts.
- User-Friendly Interface: Intuitive visuals and outputs facilitate straightforward analysis of results.
- Preferred by Professionals: Crafted for industry experts who prioritize accuracy and ease of use.
Who Should Use Archrock, Inc. (AROC)?
- Investors: Gain insights into the energy sector with a reliable investment analysis tool.
- Financial Analysts: Streamline your workflow with customizable financial models tailored for Archrock, Inc. (AROC).
- Consultants: Efficiently modify templates for client proposals or presentations related to Archrock, Inc. (AROC).
- Energy Sector Enthusiasts: Enhance your knowledge of energy market dynamics through real-world case studies.
- Educators and Students: Utilize it as a hands-on resource in energy finance and investment courses.
What the Template Contains
- Preloaded AROC Data: Historical and projected financial data, including revenue, EBIT, and capital expenditures.
- DCF and WACC Models: Professional-grade sheets for calculating intrinsic value and Weighted Average Cost of Capital.
- Editable Inputs: Yellow-highlighted cells for adjusting revenue growth, tax rates, and discount rates.
- Financial Statements: Comprehensive annual and quarterly financials for deeper analysis.
- Key Ratios: Profitability, leverage, and efficiency ratios to evaluate performance.
- Dashboard and Charts: Visual summaries of valuation outcomes and assumptions.
Disclaimer
All information, articles, and product details provided on this website are for general informational and educational purposes only. We do not claim any ownership over, nor do we intend to infringe upon, any trademarks, copyrights, logos, brand names, or other intellectual property mentioned or depicted on this site. Such intellectual property remains the property of its respective owners, and any references here are made solely for identification or informational purposes, without implying any affiliation, endorsement, or partnership.
We make no representations or warranties, express or implied, regarding the accuracy, completeness, or suitability of any content or products presented. Nothing on this website should be construed as legal, tax, investment, financial, medical, or other professional advice. In addition, no part of this site—including articles or product references—constitutes a solicitation, recommendation, endorsement, advertisement, or offer to buy or sell any securities, franchises, or other financial instruments, particularly in jurisdictions where such activity would be unlawful.
All content is of a general nature and may not address the specific circumstances of any individual or entity. It is not a substitute for professional advice or services. Any actions you take based on the information provided here are strictly at your own risk. You accept full responsibility for any decisions or outcomes arising from your use of this website and agree to release us from any liability in connection with your use of, or reliance upon, the content or products found herein.