
|
Société Industrielle et Financière de L'Artois (Arto.Pa) DCF تقييم |
Fully Editable: Tailor To Your Needs In Excel Or Sheets
Professional Design: Trusted, Industry-Standard Templates
Investor-Approved Valuation Models
MAC/PC Compatible, Fully Unlocked
No Expertise Is Needed; Easy To Follow
Société Industrielle et Financière de l'Artois (ARTO.PA) Bundle
استكشف المستقبل المالي لـ Société Industrielle et Financière de L'Artois (Artopa) مع حاسبة DCF الصديقة للاستخدام! أدخل توقعاتك على النمو والهوامش والمصروفات لتحديد القيمة الجوهرية لـ Société Industrielle et Financière de L'Artois (Artopa) وتشكيل نهج الاستثمار الخاص بك.
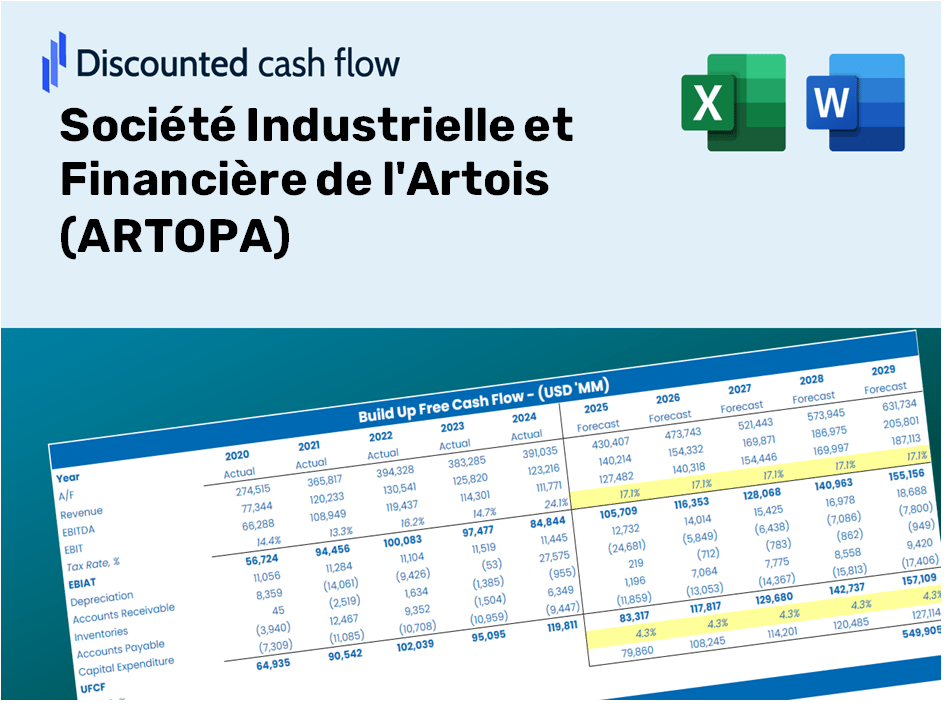
Discounted Cash Flow (DCF) - (USD MM)
| Year | AY1 2020 |
AY2 2021 |
AY3 2022 |
AY4 2023 |
AY5 2024 |
FY1 2025 |
FY2 2026 |
FY3 2027 |
FY4 2028 |
FY5 2029 |
|---|---|---|---|---|---|---|---|---|---|---|
| Revenue | 128.6 | 120.3 | 148.3 | 158.7 | 160.8 | 171.0 | 181.7 | 193.2 | 205.3 | 218.2 |
| Revenue Growth, % | 0 | -6.47 | 23.26 | 7.03 | 1.35 | 6.3 | 6.3 | 6.3 | 6.3 | 6.3 |
| EBITDA | 61.0 | 18.2 | 21.4 | 35.2 | 25.8 | 39.4 | 41.9 | 44.5 | 47.3 | 50.3 |
| EBITDA, % | 47.46 | 15.1 | 14.43 | 22.18 | 16.04 | 23.04 | 23.04 | 23.04 | 23.04 | 23.04 |
| Depreciation | 5.8 | 2.6 | .7 | 1.1 | .0 | 2.7 | 2.8 | 3.0 | 3.2 | 3.4 |
| Depreciation, % | 4.53 | 2.15 | 0.45934 | 0.67747 | 0 | 1.56 | 1.56 | 1.56 | 1.56 | 1.56 |
| EBIT | 55.2 | 15.6 | 20.7 | 34.1 | 25.8 | 36.7 | 39.0 | 41.5 | 44.1 | 46.9 |
| EBIT, % | 42.93 | 12.95 | 13.97 | 21.5 | 16.04 | 21.48 | 21.48 | 21.48 | 21.48 | 21.48 |
| Total Cash | 740.2 | 688.1 | 695.3 | 717.6 | 710.7 | 171.0 | 181.7 | 193.2 | 205.3 | 218.2 |
| Total Cash, percent | .0 | .0 | .0 | .0 | .0 | .0 | .0 | .0 | .0 | .0 |
| Account Receivables | 30.3 | 29.0 | .0 | 47.0 | 47.5 | 36.5 | 38.8 | 41.3 | 43.8 | 46.6 |
| Account Receivables, % | 23.53 | 24.11 | 0 | 29.59 | 29.55 | 21.36 | 21.36 | 21.36 | 21.36 | 21.36 |
| Inventories | 18.3 | 22.5 | 29.7 | 30.3 | 27.2 | 30.4 | 32.4 | 34.4 | 36.6 | 38.9 |
| Inventories, % | 14.26 | 18.74 | 20.05 | 19.1 | 16.9 | 17.81 | 17.81 | 17.81 | 17.81 | 17.81 |
| Accounts Payable | 20.3 | 21.3 | 22.8 | 23.5 | 20.7 | 26.2 | 27.8 | 29.6 | 31.4 | 33.4 |
| Accounts Payable, % | 15.76 | 17.73 | 15.41 | 14.79 | 12.85 | 15.31 | 15.31 | 15.31 | 15.31 | 15.31 |
| Capital Expenditure | -9.2 | -1.9 | -2.8 | -.7 | -2.9 | -4.4 | -4.7 | -5.0 | -5.3 | -5.6 |
| Capital Expenditure, % | -7.18 | -1.55 | -1.91 | -0.41342 | -1.83 | -2.58 | -2.58 | -2.58 | -2.58 | -2.58 |
| Tax Rate, % | 20.86 | 20.86 | 20.86 | 20.86 | 20.86 | 20.86 | 20.86 | 20.86 | 20.86 | 20.86 |
| EBITAT | 43.6 | 13.1 | 21.1 | 30.9 | 20.4 | 31.8 | 33.8 | 35.9 | 38.2 | 40.6 |
| Depreciation | ||||||||||
| Changes in Account Receivables | ||||||||||
| Changes in Inventories | ||||||||||
| Changes in Accounts Payable | ||||||||||
| Capital Expenditure | ||||||||||
| UFCF | 11.9 | 12.0 | 42.3 | -15.6 | 17.2 | 43.3 | 29.4 | 31.2 | 33.2 | 35.3 |
| WACC, % | 6.03 | 6.04 | 6.05 | 6.04 | 6.03 | 6.04 | 6.04 | 6.04 | 6.04 | 6.04 |
| PV UFCF | ||||||||||
| SUM PV UFCF | 145.8 | |||||||||
| Long Term Growth Rate, % | 2.00 | |||||||||
| Free cash flow (T + 1) | 36 | |||||||||
| Terminal Value | 892 | |||||||||
| Present Terminal Value | 665 | |||||||||
| Enterprise Value | 811 | |||||||||
| Net Debt | -657 | |||||||||
| Equity Value | 1,468 | |||||||||
| Diluted Shares Outstanding, MM | 0 | |||||||||
| Equity Value Per Share | 6,507.38 |
ماذا ستتلقى
- النموذج المالي الذي تم تحميله مسبقًا: استخدم بيانات Artopa الفعلية لتقييم DCF الدقيق.
- السيطرة الشاملة على التنبؤ: تعديل نمو الإيرادات ، هوامش الربح ، WACC ، وغيرها من السائقين الأساسيين.
- الحسابات في الوقت الحقيقي: توفر التحديثات الفورية رؤى أثناء تنفيذ التغييرات.
- قالب من الدرجة المهنية: وثيقة Excel مصقولة مصنفة لتقييم عالي المستوى.
- مرنة وقابلة لإعادة الاستخدام: مصمم للتكيف ، تسهيل الاستخدام المتكرر للتنبؤات المتعمقة.
الميزات الرئيسية
- 🔍 Real-Life ARTOPA المالية: بيانات تاريخية ومسقطة مملوءة مسبقًا لشركة ARTOPA للصناعة والمالية.
- ✏• المدخلات القابلة للتخصيص بالكامل: تعديل جميع المعلمات الأساسية (الخلايا الصفراء) مثل WACC والنمو٪ ومعدلات الضرائب.
- 📊 تقييم DCF المهني: تقيم الصيغ المتكاملة القيمة الجوهرية لـ ARTOPA باستخدام منهجية التدفق النقدي المخفض.
- ⚡ النتائج الفورية: تصور تقييم ARTOPA فور إجراء التعديلات.
- تحليل السيناريو: تقييم ومقارنة نتائج الافتراضات المالية المختلفة جنبا إلى جنب.
كيف تعمل
- الخطوة 1: قم بتنزيل ملف Excel لـ Société Industrielle et Financière de L'Artois (Artopa).
- الخطوة 2: فحص البيانات المملوءة مسبقًا لـ Artopa ، بما في ذلك الشخصيات التاريخية والتوقعات المستقبلية.
- الخطوة 3: تعديل الافتراضات الرئيسية (المبرمة باللون الأصفر) وفقا لتحليلك.
- الخطوة 4: راقب عمليات إعادة الحساب التلقائية التي تعكس القيمة الجوهرية لـ Artopa.
- الخطوة 5: الاستفادة من نتائج قرارات الاستثمار المستنيرة أو أغراض الإبلاغ.
لماذا تختار حاسبة Artopa؟
- توفير الوقت: لا حاجة لإنشاء نموذج DCF من الألف إلى الياء - أداةنا جاهزة للاستخدام الفوري.
- الدقة المعززة: البيانات المالية التي يمكن الاعتماد عليها تقلل من أخطاء التقييم.
- قابلة للتخصيص بالكامل: اضبط النموذج لتناسب افتراضاتك وتوقعاتك المحددة.
- سهل الاستخدام: المخططات والمخرجات البديهية تبسيط تفسير النتائج.
- خبير معتمد: تم إنشاؤها للمهنيين الذين يعطون الأولوية للدقة وسهولة الاستخدام.
من يمكنه الاستفادة من هذا المنتج؟
- المستثمرون: تقييم فعال القيمة العادلة لـ Société Industrielle et Financière de L'Artois (Artopa) قبل اتخاذ قرارات الاستثمار.
- المدير المالي: الاستفادة من نموذج DCF عالي الجودة لتقارير وتحليل مالي دقيق.
- الاستشاريون: تخصيص القالب بسلاسة لتقارير التقييم المصممة لتلبية احتياجات العميل.
- رواد الأعمال: الحصول على رؤى حول ممارسات النمذجة المالية التي تستخدمها الشركات الرائدة.
- المعلمون: استخدم هذا المورد كمساعدات تعليمية لتوضيح تقنيات التقييم.
محتويات النموذج
- نموذج DCF الشامل: نموذج قابل للتحرير يحتوي على حسابات تقييم مفصلة.
- بيانات العالم الحقيقي: تم تحميل البيانات المالية التاريخية والمتوقعة لشركة Société Industrielle et Financière de l'Artois (ARTOPA) مسبقًا لتحليلك.
- المعلمات القابلة للتخصيص: تعديل WACC ومعدلات النمو والافتراضات الضريبية لاستكشاف سيناريوهات مختلفة.
- البيانات المالية استكمال الأعطال السنوية والفصلية للرؤى المتعمقة.
- النسب الرئيسية: تحليل مدمج يغطي الربحية والكفاءة ومقاييس الرافعة المالية.
- لوحة القيادة مع المخرجات المرئية: مخططات وجداول مصممة لتحقيق نتائج واضحة وقابلة للتنفيذ.
Disclaimer
All information, articles, and product details provided on this website are for general informational and educational purposes only. We do not claim any ownership over, nor do we intend to infringe upon, any trademarks, copyrights, logos, brand names, or other intellectual property mentioned or depicted on this site. Such intellectual property remains the property of its respective owners, and any references here are made solely for identification or informational purposes, without implying any affiliation, endorsement, or partnership.
We make no representations or warranties, express or implied, regarding the accuracy, completeness, or suitability of any content or products presented. Nothing on this website should be construed as legal, tax, investment, financial, medical, or other professional advice. In addition, no part of this site—including articles or product references—constitutes a solicitation, recommendation, endorsement, advertisement, or offer to buy or sell any securities, franchises, or other financial instruments, particularly in jurisdictions where such activity would be unlawful.
All content is of a general nature and may not address the specific circumstances of any individual or entity. It is not a substitute for professional advice or services. Any actions you take based on the information provided here are strictly at your own risk. You accept full responsibility for any decisions or outcomes arising from your use of this website and agree to release us from any liability in connection with your use of, or reliance upon, the content or products found herein.