
|
Assembly Biosciences ، Inc. (ASMB) DCF تقييم |
Fully Editable: Tailor To Your Needs In Excel Or Sheets
Professional Design: Trusted, Industry-Standard Templates
Investor-Approved Valuation Models
MAC/PC Compatible, Fully Unlocked
No Expertise Is Needed; Easy To Follow
Assembly Biosciences, Inc. (ASMB) Bundle
STREMELLINE ASSEMBLY BIOSCIENCES ، Inc. (ASMB) تقييم مع هذه الآلة الحاسبة DCF متعددة الاستخدامات! مع REAL Assembly Biosciences ، Inc. (ASMB) ومدخلات التنبؤ القابلة للتعديل ، يمكنك استكشاف مختلف السيناريوهات وتحديد القيمة العادلة للتجميع (ASMB) في دقائق فقط.
What You Will Get
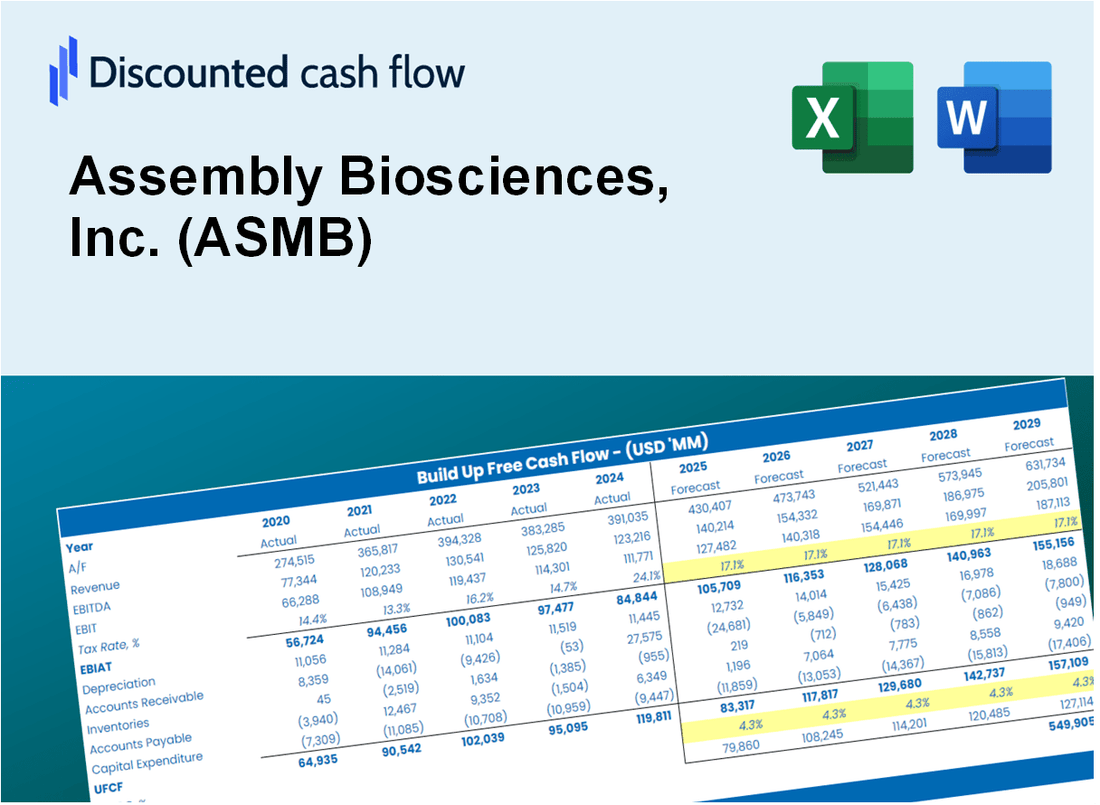
- Pre-Filled Financial Model: Assembly Biosciences' actual data enables precise DCF valuation.
- Full Forecast Control: Adjust revenue growth, margins, WACC, and other key drivers specific to ASMB.
- Instant Calculations: Automatic updates ensure you see results as you make changes in real-time.
- Investor-Ready Template: A polished Excel file designed for professional-grade valuation of Assembly Biosciences.
- Customizable and Reusable: Tailored for flexibility, allowing repeated use for detailed forecasts on ASMB.
Key Features
- Comprehensive Data: Assembly Biosciences' historical financial statements and detailed projections.
- Customizable Parameters: Adjust inputs such as WACC, tax rates, revenue growth, and EBITDA margins.
- Real-Time Insights: View Assembly Biosciences' intrinsic value update instantly.
- Intuitive Visualizations: Dashboard graphs illustrate valuation outcomes and essential metrics.
- Designed for Precision: A reliable tool for analysts, investors, and finance professionals.
How It Works
- Download the Template: Gain immediate access to the Excel-based ASMB DCF Calculator.
- Input Your Assumptions: Modify the yellow-highlighted cells for growth rates, WACC, margins, and more.
- Instant Calculations: The model automatically recalculates Assembly Biosciences’ intrinsic value.
- Test Scenarios: Experiment with various assumptions to assess potential valuation shifts.
- Analyze and Decide: Utilize the findings to inform your investment or financial analysis.
Why Choose This Calculator for Assembly Biosciences, Inc. (ASMB)?
- Accuracy: Utilizes real Assembly Biosciences financial data for precise calculations.
- Flexibility: Allows users to easily adjust and test various input parameters.
- Time-Saving: Eliminate the need to create a DCF model from the ground up.
- Professional-Grade: Crafted with the expertise and usability expected at the CFO level.
- User-Friendly: Intuitive design makes it accessible for users without extensive financial modeling skills.
Who Should Use This Product?
- Professional Investors: Develop comprehensive and accurate valuation models for investment analysis in Assembly Biosciences, Inc. (ASMB).
- Corporate Finance Teams: Evaluate valuation scenarios to inform strategic decisions within their organizations.
- Consultants and Advisors: Deliver precise valuation insights for clients interested in Assembly Biosciences, Inc. (ASMB).
- Students and Educators: Utilize real-world data to enhance learning and practice in financial modeling.
- Biotech Enthusiasts: Gain insights into how biotechnology firms like Assembly Biosciences, Inc. (ASMB) are valued in the market.
What the Template Contains
- Historical Data: Includes Assembly Biosciences, Inc.'s (ASMB) past financials and baseline forecasts.
- DCF and Levered DCF Models: Detailed templates to calculate Assembly Biosciences, Inc.'s (ASMB) intrinsic value.
- WACC Sheet: Pre-built calculations for Weighted Average Cost of Capital.
- Editable Inputs: Modify key drivers like growth rates, EBITDA %, and CAPEX assumptions.
- Quarterly and Annual Statements: A complete breakdown of Assembly Biosciences, Inc.'s (ASMB) financials.
- Interactive Dashboard: Visualize valuation results and projections dynamically.
Disclaimer
All information, articles, and product details provided on this website are for general informational and educational purposes only. We do not claim any ownership over, nor do we intend to infringe upon, any trademarks, copyrights, logos, brand names, or other intellectual property mentioned or depicted on this site. Such intellectual property remains the property of its respective owners, and any references here are made solely for identification or informational purposes, without implying any affiliation, endorsement, or partnership.
We make no representations or warranties, express or implied, regarding the accuracy, completeness, or suitability of any content or products presented. Nothing on this website should be construed as legal, tax, investment, financial, medical, or other professional advice. In addition, no part of this site—including articles or product references—constitutes a solicitation, recommendation, endorsement, advertisement, or offer to buy or sell any securities, franchises, or other financial instruments, particularly in jurisdictions where such activity would be unlawful.
All content is of a general nature and may not address the specific circumstances of any individual or entity. It is not a substitute for professional advice or services. Any actions you take based on the information provided here are strictly at your own risk. You accept full responsibility for any decisions or outcomes arising from your use of this website and agree to release us from any liability in connection with your use of, or reliance upon, the content or products found herein.