
|
Altisource Portfolio Solutions S.A (ASPS) تقييم DCF |
Fully Editable: Tailor To Your Needs In Excel Or Sheets
Professional Design: Trusted, Industry-Standard Templates
Investor-Approved Valuation Models
MAC/PC Compatible, Fully Unlocked
No Expertise Is Needed; Easy To Follow
Altisource Portfolio Solutions S.A. (ASPS) Bundle
تبحث لتحديد القيمة الجوهرية لحلول محفظة Altisource S.A.؟ يدمج حاسبة ASPS DCF الخاصة بنا بيانات العالم الحقيقي مع ميزات تخصيص واسعة ، مما يتيح لك ضبط التوقعات وتعزيز استراتيجيات الاستثمار الخاصة بك.
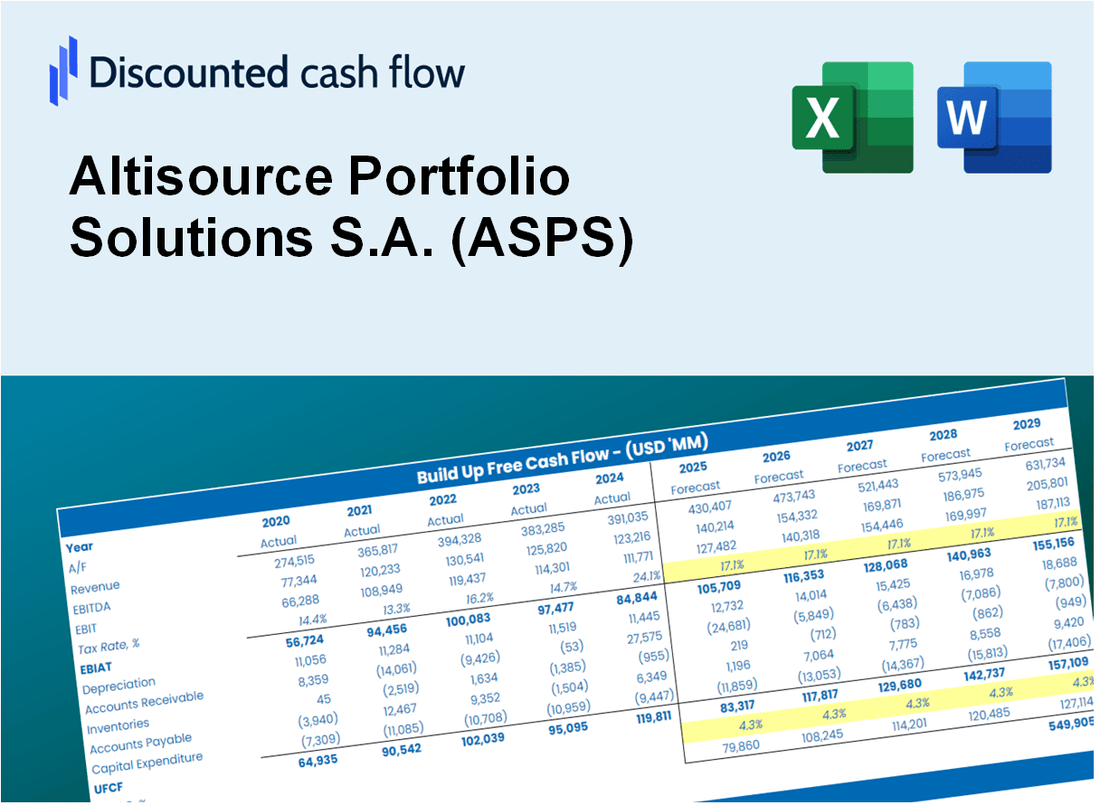
Discounted Cash Flow (DCF) - (USD MM)
| Year | AY1 2020 |
AY2 2021 |
AY3 2022 |
AY4 2023 |
AY5 2024 |
FY1 2025 |
FY2 2026 |
FY3 2027 |
FY4 2028 |
FY5 2029 |
|---|---|---|---|---|---|---|---|---|---|---|
| Revenue | 365.5 | 178.5 | 153.1 | 145.1 | 160.1 | 136.0 | 115.5 | 98.1 | 83.3 | 70.8 |
| Revenue Growth, % | 0 | -51.18 | -14.2 | -5.26 | 10.39 | -15.06 | -15.06 | -15.06 | -15.06 | -15.06 |
| EBITDA | -.1 | -38.0 | -19.6 | -6.9 | 11.5 | -8.6 | -7.3 | -6.2 | -5.3 | -4.5 |
| EBITDA, % | -0.03310108 | -21.28 | -12.82 | -4.76 | 7.2 | -6.34 | -6.34 | -6.34 | -6.34 | -6.34 |
| Depreciation | 393.9 | 245.0 | 194.1 | 9.3 | 7.6 | 84.7 | 71.9 | 61.1 | 51.9 | 44.1 |
| Depreciation, % | 107.76 | 137.27 | 126.76 | 6.44 | 4.75 | 62.24 | 62.24 | 62.24 | 62.24 | 62.24 |
| EBIT | -394.0 | -282.9 | -213.7 | -16.2 | 3.9 | -84.0 | -71.3 | -60.6 | -51.5 | -43.7 |
| EBIT, % | -107.8 | -158.55 | -139.58 | -11.2 | 2.44 | -61.75 | -61.75 | -61.75 | -61.75 | -61.75 |
| Total Cash | 58.3 | 98.1 | 51.0 | 32.5 | 29.8 | 39.5 | 33.6 | 28.5 | 24.2 | 20.6 |
| Total Cash, percent | .0 | .0 | .0 | .0 | .0 | .0 | .0 | .0 | .0 | .0 |
| Account Receivables | 22.4 | 18.0 | 13.0 | 11.7 | 16.1 | 11.6 | 9.9 | 8.4 | 7.1 | 6.1 |
| Account Receivables, % | 6.13 | 10.09 | 8.48 | 8.05 | 10.05 | 8.56 | 8.56 | 8.56 | 8.56 | 8.56 |
| Inventories | .0 | .0 | .0 | .0 | .0 | .0 | .0 | .0 | .0 | .0 |
| Inventories, % | 0 | 0 | 0 | 0 | 0 | 0 | 0 | 0 | 0 | 0 |
| Accounts Payable | 16.8 | 16.0 | 15.0 | 15.3 | 17.9 | 12.2 | 10.4 | 8.8 | 7.5 | 6.4 |
| Accounts Payable, % | 4.6 | 8.95 | 9.78 | 10.53 | 11.17 | 9.01 | 9.01 | 9.01 | 9.01 | 9.01 |
| Capital Expenditure | -2.7 | -1.4 | -.9 | .0 | .0 | -.6 | -.5 | -.4 | -.3 | -.3 |
| Capital Expenditure, % | -0.73999 | -0.77275 | -0.56361 | 0 | -0.00187343 | -0.41564 | -0.41564 | -0.41564 | -0.41564 | -0.41564 |
| Tax Rate, % | 6.29 | 6.29 | 6.29 | 6.29 | 6.29 | 6.29 | 6.29 | 6.29 | 6.29 | 6.29 |
| EBITAT | -452.8 | -218.6 | -237.4 | -17.5 | 3.7 | -79.1 | -67.2 | -57.1 | -48.5 | -41.2 |
| Depreciation | ||||||||||
| Changes in Account Receivables | ||||||||||
| Changes in Inventories | ||||||||||
| Changes in Accounts Payable | ||||||||||
| Capital Expenditure | ||||||||||
| UFCF | -67.2 | 28.5 | -40.1 | -6.5 | 9.5 | 3.8 | 4.1 | 3.5 | 3.0 | 2.5 |
| WACC, % | 10.29 | 8.52 | 10.29 | 10.29 | 9.8 | 9.84 | 9.84 | 9.84 | 9.84 | 9.84 |
| PV UFCF | ||||||||||
| SUM PV UFCF | 13.1 | |||||||||
| Long Term Growth Rate, % | 2.00 | |||||||||
| Free cash flow (T + 1) | 3 | |||||||||
| Terminal Value | 33 | |||||||||
| Present Terminal Value | 21 | |||||||||
| Enterprise Value | 34 | |||||||||
| Net Debt | 204 | |||||||||
| Equity Value | -170 | |||||||||
| Diluted Shares Outstanding, MM | 29 | |||||||||
| Equity Value Per Share | -5.97 |
What You Will Get
- Real ASPS Financial Data: Pre-filled with Altisource Portfolio Solutions’ historical and projected data for precise analysis.
- Fully Editable Template: Modify key inputs like revenue growth, WACC, and EBITDA % with ease.
- Automatic Calculations: See Altisource Portfolio Solutions’ intrinsic value update instantly based on your changes.
- Professional Valuation Tool: Designed for investors, analysts, and consultants seeking accurate DCF results.
- User-Friendly Design: Simple structure and clear instructions for all experience levels.
Key Features
- Comprehensive ASPS Data: Pre-filled with Altisource’s historical financials and future projections.
- Fully Customizable Inputs: Modify revenue growth, profit margins, WACC, tax rates, and capital expenditures to suit your analysis.
- Dynamic Valuation Model: Automatic recalculations of Net Present Value (NPV) and intrinsic value based on your customized inputs.
- Scenario Analysis: Develop various forecast scenarios to explore different valuation possibilities.
- User-Friendly Interface: Intuitive design that caters to both professionals and newcomers.
How It Works
- 1. Access the Template: Download and open the Excel file containing Altisource Portfolio Solutions S.A. (ASPS) preloaded data.
- 2. Modify Assumptions: Adjust key inputs such as growth rates, WACC, and capital expenditures.
- 3. Instant Results: The DCF model automatically calculates intrinsic value and NPV in real-time.
- 4. Explore Scenarios: Evaluate multiple forecasts to assess various valuation outcomes.
- 5. Present with Assurance: Deliver professional valuation insights to enhance your decision-making process.
Why Choose Altisource Portfolio Solutions (ASPS)?
- Streamline Operations: Leverage our comprehensive solutions to enhance your workflow efficiency.
- Enhance Performance: Benefit from our reliable data analytics to drive better business outcomes.
- Fully Adaptable: Customize our services to align with your specific investment strategies and goals.
- User-Friendly Interface: Enjoy intuitive tools and dashboards that simplify complex data interpretation.
- Endorsed by Industry Leaders: Our solutions are trusted by professionals committed to excellence and innovation.
Who Should Use This Product?
- Investors: Accurately assess Altisource Portfolio Solutions S.A.'s (ASPS) fair value prior to making investment choices.
- CFOs: Utilize a professional-grade DCF model for comprehensive financial reporting and analysis.
- Consultants: Efficiently customize the template for client valuation reports.
- Entrepreneurs: Acquire insights into financial modeling practices adopted by leading companies.
- Educators: Employ it as a teaching resource to illustrate valuation methodologies.
What the Template Contains
- Operating and Balance Sheet Data: Pre-filled Altisource Portfolio Solutions S.A. (ASPS) historical data and forecasts, including revenue, EBITDA, EBIT, and capital expenditures.
- WACC Calculation: A dedicated sheet for Weighted Average Cost of Capital (WACC), featuring parameters like Beta, risk-free rate, and share price.
- DCF Valuation (Unlevered and Levered): Editable Discounted Cash Flow models illustrating intrinsic value with comprehensive calculations.
- Financial Statements: Pre-loaded financial statements (annual and quarterly) to facilitate analysis.
- Key Ratios: Includes profitability, leverage, and efficiency ratios for Altisource Portfolio Solutions S.A. (ASPS).
- Dashboard and Charts: Visual summary of valuation outputs and assumptions to easily analyze results.
Disclaimer
All information, articles, and product details provided on this website are for general informational and educational purposes only. We do not claim any ownership over, nor do we intend to infringe upon, any trademarks, copyrights, logos, brand names, or other intellectual property mentioned or depicted on this site. Such intellectual property remains the property of its respective owners, and any references here are made solely for identification or informational purposes, without implying any affiliation, endorsement, or partnership.
We make no representations or warranties, express or implied, regarding the accuracy, completeness, or suitability of any content or products presented. Nothing on this website should be construed as legal, tax, investment, financial, medical, or other professional advice. In addition, no part of this site—including articles or product references—constitutes a solicitation, recommendation, endorsement, advertisement, or offer to buy or sell any securities, franchises, or other financial instruments, particularly in jurisdictions where such activity would be unlawful.
All content is of a general nature and may not address the specific circumstances of any individual or entity. It is not a substitute for professional advice or services. Any actions you take based on the information provided here are strictly at your own risk. You accept full responsibility for any decisions or outcomes arising from your use of this website and agree to release us from any liability in connection with your use of, or reliance upon, the content or products found herein.