
|
AutoHome Inc. (ATHM) DCF تقييم |
Fully Editable: Tailor To Your Needs In Excel Or Sheets
Professional Design: Trusted, Industry-Standard Templates
Investor-Approved Valuation Models
MAC/PC Compatible, Fully Unlocked
No Expertise Is Needed; Easy To Follow
Autohome Inc. (ATHM) Bundle
تقييم التوقعات المالية لشركة AutoHome Inc. كخبير! توفر حاسبة DCF (ATHM) هذه البيانات المالية المليئة مسبقًا جنبًا إلى جنب مع المرونة لتعديل نمو الإيرادات ، WACC ، الهوامش ، وغيرها من الافتراضات الأساسية التي تتماشى مع توقعاتك.
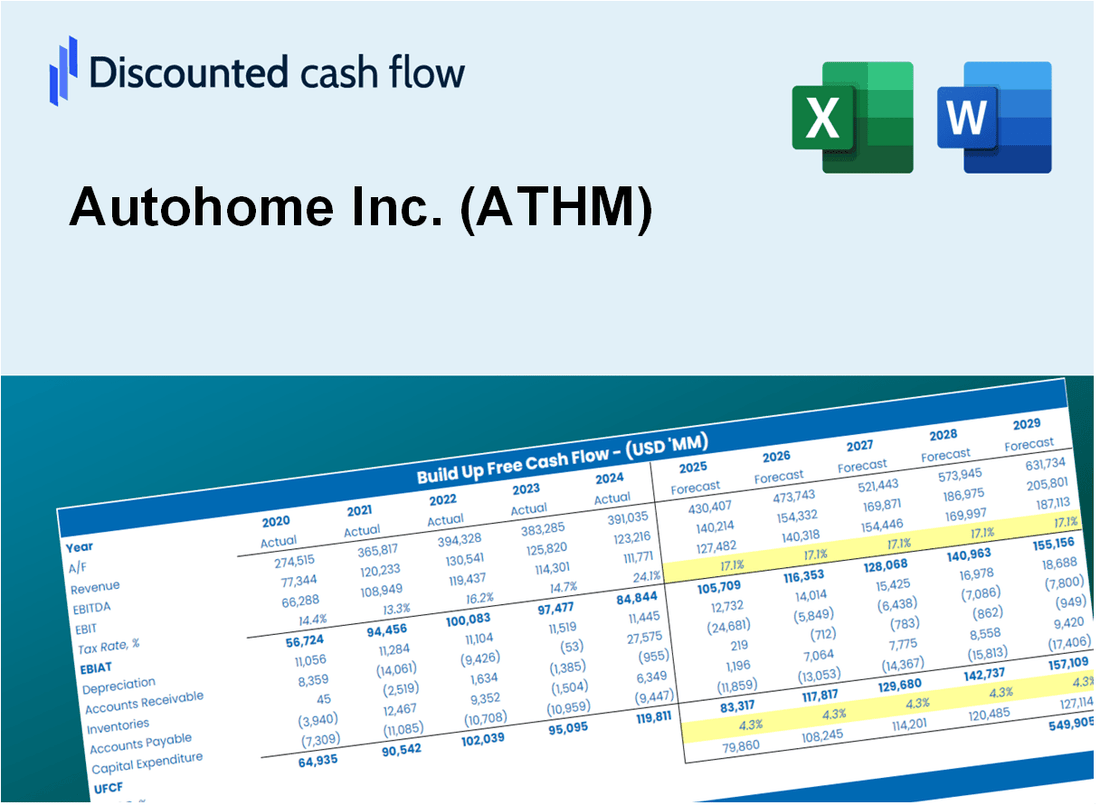
Discounted Cash Flow (DCF) - (USD MM)
| Year | AY1 2020 |
AY2 2021 |
AY3 2022 |
AY4 2023 |
AY5 2024 |
FY1 2025 |
FY2 2026 |
FY3 2027 |
FY4 2028 |
FY5 2029 |
|---|---|---|---|---|---|---|---|---|---|---|
| Revenue | 1,215.9 | 1,016.2 | 974.6 | 1,008.8 | 988.5 | 941.5 | 896.8 | 854.1 | 813.5 | 774.8 |
| Revenue Growth, % | 0 | -16.42 | -4.09 | 3.51 | -2.01 | -4.75 | -4.75 | -4.75 | -4.75 | -4.75 |
| EBITDA | 466.0 | 310.7 | 234.7 | 209.2 | 175.2 | 247.5 | 235.8 | 224.5 | 213.9 | 203.7 |
| EBITDA, % | 38.32 | 30.58 | 24.08 | 20.74 | 17.73 | 26.29 | 26.29 | 26.29 | 26.29 | 26.29 |
| Depreciation | 23.9 | 60.5 | 59.5 | 49.5 | 34.3 | 42.2 | 40.2 | 38.3 | 36.5 | 34.7 |
| Depreciation, % | 1.97 | 5.96 | 6.11 | 4.91 | 3.47 | 4.48 | 4.48 | 4.48 | 4.48 | 4.48 |
| EBIT | 442.1 | 250.2 | 175.2 | 159.7 | 140.9 | 205.3 | 195.6 | 186.3 | 177.4 | 169.0 |
| EBIT, % | 36.36 | 24.62 | 17.97 | 15.83 | 14.26 | 21.81 | 21.81 | 21.81 | 21.81 | 21.81 |
| Total Cash | 2,054.3 | 2,911.3 | 3,100.6 | 3,306.8 | 3,274.0 | 941.5 | 896.8 | 854.1 | 813.5 | 774.8 |
| Total Cash, percent | .0 | .0 | .0 | .0 | .0 | .0 | .0 | .0 | .0 | .0 |
| Account Receivables | 480.6 | 318.1 | 283.0 | 214.9 | 206.2 | 267.4 | 254.7 | 242.6 | 231.1 | 220.1 |
| Account Receivables, % | 39.53 | 31.3 | 29.03 | 21.3 | 20.86 | 28.4 | 28.4 | 28.4 | 28.4 | 28.4 |
| Inventories | .0 | .0 | .0 | .0 | .0 | .0 | .0 | .0 | .0 | .0 |
| Inventories, % | 0 | 0 | 0 | 0 | 0 | 0 | 0 | 0 | 0 | 0 |
| Accounts Payable | .0 | .0 | .0 | .0 | .0 | .0 | .0 | .0 | .0 | .0 |
| Accounts Payable, % | 0 | 0 | 0 | 0 | 0 | 0 | 0 | 0 | 0 | 0 |
| Capital Expenditure | -37.1 | -30.8 | -16.5 | -11.1 | -19.7 | -20.5 | -19.5 | -18.6 | -17.7 | -16.8 |
| Capital Expenditure, % | -3.05 | -3.03 | -1.69 | -1.1 | -1.99 | -2.17 | -2.17 | -2.17 | -2.17 | -2.17 |
| Tax Rate, % | -6.28 | -6.28 | -6.28 | -6.28 | -6.28 | -6.28 | -6.28 | -6.28 | -6.28 | -6.28 |
| EBITAT | 409.2 | 294.2 | 193.3 | 162.6 | 149.8 | 202.3 | 192.6 | 183.5 | 174.8 | 166.5 |
| Depreciation | ||||||||||
| Changes in Account Receivables | ||||||||||
| Changes in Inventories | ||||||||||
| Changes in Accounts Payable | ||||||||||
| Capital Expenditure | ||||||||||
| UFCF | -84.7 | 486.5 | 271.4 | 269.1 | 173.2 | 162.7 | 226.1 | 215.3 | 205.1 | 195.3 |
| WACC, % | 4.6 | 4.62 | 4.62 | 4.62 | 4.62 | 4.61 | 4.61 | 4.61 | 4.61 | 4.61 |
| PV UFCF | ||||||||||
| SUM PV UFCF | 877.3 | |||||||||
| Long Term Growth Rate, % | 1.00 | |||||||||
| Free cash flow (T + 1) | 197 | |||||||||
| Terminal Value | 5,457 | |||||||||
| Present Terminal Value | 4,355 | |||||||||
| Enterprise Value | 5,233 | |||||||||
| Net Debt | -224 | |||||||||
| Equity Value | 5,457 | |||||||||
| Diluted Shares Outstanding, MM | 8 | |||||||||
| Equity Value Per Share | 717.78 |
What You Will Get
- Pre-Filled Financial Model: Autohome Inc.’s actual data allows for accurate DCF valuation.
- Full Forecast Control: Modify revenue growth, margins, WACC, and other essential drivers as needed.
- Instant Calculations: Real-time updates provide immediate results as you adjust inputs.
- Investor-Ready Template: A polished Excel file crafted for high-quality valuation presentations.
- Customizable and Reusable: Designed for adaptability, enabling ongoing use for comprehensive forecasts.
Key Features
- Comprehensive Autohome Financials: Access detailed pre-loaded historical data and future forecasts for Autohome Inc. (ATHM).
- Adjustable Forecast Parameters: Modify highlighted cells for key metrics such as WACC, growth rates, and profit margins.
- Real-Time Calculations: Automatic updates to DCF, Net Present Value (NPV), and cash flow assessments.
- Interactive Dashboard: User-friendly charts and summaries to help visualize your valuation findings.
- Designed for All Skill Levels: An intuitive layout suitable for investors, CFOs, and consultants alike.
How It Works
- 1. Access the Model: Download and open the Excel file featuring Autohome Inc.'s (ATHM) preloaded data.
- 2. Adjust Assumptions: Modify critical inputs such as growth rates, WACC, and capital expenditures to fit your analysis.
- 3. Get Instant Feedback: The DCF model automatically computes intrinsic value and NPV based on your inputs.
- 4. Explore Different Scenarios: Evaluate various forecasts to understand potential valuation variations.
- 5. Present with Assurance: Deliver expert valuation insights to bolster your decision-making process.
Why Choose the Autohome Inc. (ATHM) Calculator?
- Accuracy: Utilizes real Autohome financial data to ensure precise calculations.
- Flexibility: Allows users to easily adjust and test various inputs.
- Time-Saving: Avoid the complexities of creating a financial model from the ground up.
- Professional-Grade: Crafted with the expertise and detail expected at the CFO level.
- User-Friendly: Intuitive design makes it accessible for users without extensive financial modeling skills.
Who Should Use This Product?
- Individual Investors: Make informed decisions about buying or selling Autohome Inc. (ATHM) stock.
- Financial Analysts: Streamline valuation processes with ready-to-use financial models specific to Autohome Inc. (ATHM).
- Consultants: Deliver professional valuation insights regarding Autohome Inc. (ATHM) to clients quickly and accurately.
- Business Owners: Understand how companies like Autohome Inc. (ATHM) are valued to guide your own strategy.
- Finance Students: Learn valuation techniques using real-world data and scenarios related to Autohome Inc. (ATHM).
What the Template Contains
- Pre-Filled DCF Model: Autohome Inc.'s (ATHM) financial data preloaded for immediate use.
- WACC Calculator: Detailed calculations for Weighted Average Cost of Capital.
- Financial Ratios: Evaluate Autohome Inc.'s (ATHM) profitability, leverage, and efficiency.
- Editable Inputs: Change assumptions such as growth, margins, and CAPEX to fit your scenarios.
- Financial Statements: Annual and quarterly reports to support detailed analysis.
- Interactive Dashboard: Easily visualize key valuation metrics and results.
Disclaimer
All information, articles, and product details provided on this website are for general informational and educational purposes only. We do not claim any ownership over, nor do we intend to infringe upon, any trademarks, copyrights, logos, brand names, or other intellectual property mentioned or depicted on this site. Such intellectual property remains the property of its respective owners, and any references here are made solely for identification or informational purposes, without implying any affiliation, endorsement, or partnership.
We make no representations or warranties, express or implied, regarding the accuracy, completeness, or suitability of any content or products presented. Nothing on this website should be construed as legal, tax, investment, financial, medical, or other professional advice. In addition, no part of this site—including articles or product references—constitutes a solicitation, recommendation, endorsement, advertisement, or offer to buy or sell any securities, franchises, or other financial instruments, particularly in jurisdictions where such activity would be unlawful.
All content is of a general nature and may not address the specific circumstances of any individual or entity. It is not a substitute for professional advice or services. Any actions you take based on the information provided here are strictly at your own risk. You accept full responsibility for any decisions or outcomes arising from your use of this website and agree to release us from any liability in connection with your use of, or reliance upon, the content or products found herein.