
|
AXOGEN ، Inc. (AXGN) DCF تقييم |
Fully Editable: Tailor To Your Needs In Excel Or Sheets
Professional Design: Trusted, Industry-Standard Templates
Investor-Approved Valuation Models
MAC/PC Compatible, Fully Unlocked
No Expertise Is Needed; Easy To Follow
AxoGen, Inc. (AXGN) Bundle
اكتشف القيمة الحقيقية لـ Axogen ، Inc. (AXGN) مع حاسبة DCF المهنية! اضبط افتراضات المفتاح ، واستكشاف السيناريوهات المختلفة ، وقم بتقييم كيفية تأثير التغييرات على تقييم Axogen ، Inc. (AXGN) - كل ذلك ضمن قالب Excel واحد.
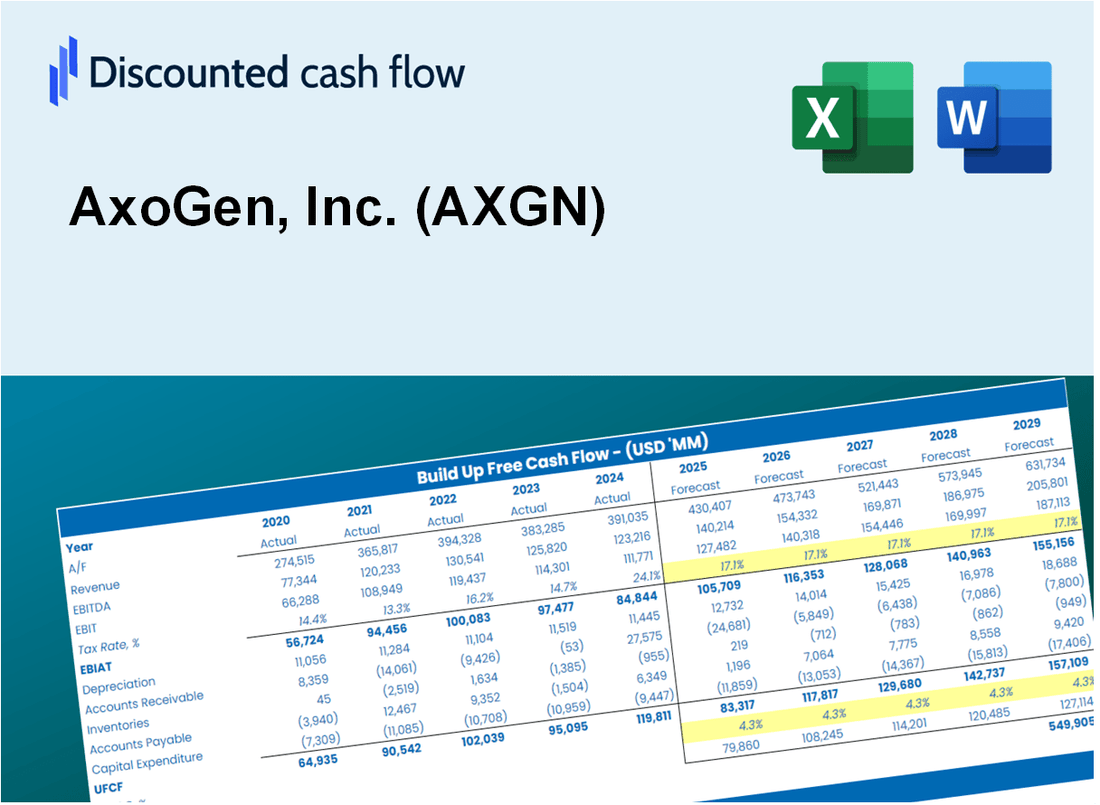
Discounted Cash Flow (DCF) - (USD MM)
| Year | AY1 2020 |
AY2 2021 |
AY3 2022 |
AY4 2023 |
AY5 2024 |
FY1 2025 |
FY2 2026 |
FY3 2027 |
FY4 2028 |
FY5 2029 |
|---|---|---|---|---|---|---|---|---|---|---|
| Revenue | 112.3 | 127.4 | 138.6 | 159.0 | 187.3 | 213.0 | 242.2 | 275.3 | 313.0 | 355.9 |
| Revenue Growth, % | 0 | 13.41 | 8.81 | 14.74 | 17.81 | 13.69 | 13.69 | 13.69 | 13.69 | 13.69 |
| EBITDA | -19.3 | -20.9 | -23.5 | -13.3 | 6.1 | -23.7 | -26.9 | -30.6 | -34.8 | -39.6 |
| EBITDA, % | -17.16 | -16.4 | -16.94 | -8.38 | 3.24 | -11.13 | -11.13 | -11.13 | -11.13 | -11.13 |
| Depreciation | 3.5 | 4.7 | 4.9 | 5.6 | 7.8 | 7.7 | 8.7 | 9.9 | 11.3 | 12.8 |
| Depreciation, % | 3.08 | 3.72 | 3.5 | 3.49 | 4.18 | 3.6 | 3.6 | 3.6 | 3.6 | 3.6 |
| EBIT | -22.7 | -25.6 | -28.3 | -18.9 | -1.8 | -31.4 | -35.7 | -40.5 | -46.1 | -52.4 |
| EBIT, % | -20.24 | -20.12 | -20.44 | -11.87 | -0.93841 | -14.72 | -14.72 | -14.72 | -14.72 | -14.72 |
| Total Cash | 104.0 | 84.1 | 48.8 | 31.0 | 33.5 | 98.5 | 112.0 | 127.3 | 144.7 | 164.6 |
| Total Cash, percent | .0 | .0 | .0 | .0 | .0 | .0 | .0 | .0 | .0 | .0 |
| Account Receivables | 17.6 | 18.2 | 22.2 | 25.1 | 24.1 | 31.8 | 36.1 | 41.1 | 46.7 | 53.1 |
| Account Receivables, % | 15.69 | 14.26 | 16.01 | 15.81 | 12.87 | 14.93 | 14.93 | 14.93 | 14.93 | 14.93 |
| Inventories | 12.5 | 16.7 | 18.9 | 23.0 | 33.2 | 29.9 | 33.9 | 38.6 | 43.9 | 49.9 |
| Inventories, % | 11.16 | 13.11 | 13.64 | 14.48 | 17.71 | 14.02 | 14.02 | 14.02 | 14.02 | 14.02 |
| Accounts Payable | 4.6 | 5.9 | 9.0 | 11.8 | 8.0 | 11.5 | 13.0 | 14.8 | 16.8 | 19.1 |
| Accounts Payable, % | 4.09 | 4.65 | 6.47 | 7.4 | 4.27 | 5.38 | 5.38 | 5.38 | 5.38 | 5.38 |
| Capital Expenditure | -22.6 | -28.4 | -21.3 | -14.9 | -4.5 | -29.6 | -33.7 | -38.3 | -43.5 | -49.5 |
| Capital Expenditure, % | -20.12 | -22.3 | -15.34 | -9.38 | -2.41 | -13.91 | -13.91 | -13.91 | -13.91 | -13.91 |
| Tax Rate, % | 0 | 0 | 0 | 0 | 0 | 0 | 0 | 0 | 0 | 0 |
| EBITAT | -22.7 | -25.6 | -28.3 | -18.9 | -1.8 | -31.4 | -35.7 | -40.5 | -46.1 | -52.4 |
| Depreciation | ||||||||||
| Changes in Account Receivables | ||||||||||
| Changes in Inventories | ||||||||||
| Changes in Accounts Payable | ||||||||||
| Capital Expenditure | ||||||||||
| UFCF | -67.4 | -52.7 | -47.9 | -32.5 | -11.3 | -54.2 | -67.5 | -76.8 | -87.3 | -99.2 |
| WACC, % | 9.05 | 9.05 | 9.05 | 9.05 | 9.05 | 9.05 | 9.05 | 9.05 | 9.05 | 9.05 |
| PV UFCF | ||||||||||
| SUM PV UFCF | -291.7 | |||||||||
| Long Term Growth Rate, % | 2.00 | |||||||||
| Free cash flow (T + 1) | -101 | |||||||||
| Terminal Value | -1,435 | |||||||||
| Present Terminal Value | -930 | |||||||||
| Enterprise Value | -1,222 | |||||||||
| Net Debt | 41 | |||||||||
| Equity Value | -1,263 | |||||||||
| Diluted Shares Outstanding, MM | 44 | |||||||||
| Equity Value Per Share | -28.54 |
What You Will Get
- Real AxoGen Data: Preloaded financials – from revenue to EBIT – based on actual and projected figures.
- Full Customization: Adjust all critical parameters (yellow cells) like WACC, growth %, and tax rates.
- Instant Valuation Updates: Automatic recalculations to analyze the impact of changes on AxoGen’s fair value.
- Versatile Excel Template: Tailored for quick edits, scenario testing, and detailed projections.
- Time-Saving and Accurate: Skip building models from scratch while maintaining precision and flexibility.
Key Features
- Pre-Loaded Data: AxoGen, Inc.'s historical financial statements and pre-filled forecasts.
- Fully Adjustable Inputs: Modify WACC, tax rates, revenue growth, and EBITDA margins to fit your analysis.
- Instant Results: View AxoGen, Inc.'s intrinsic value recalculating in real time.
- Clear Visual Outputs: Dashboard charts present valuation results and essential metrics.
- Built for Accuracy: A professional tool tailored for analysts, investors, and finance professionals.
How It Works
- Download: Obtain the pre-prepared Excel file featuring AxoGen, Inc.'s (AXGN) financial data.
- Customize: Modify projections, including revenue growth, EBITDA %, and WACC.
- Update Automatically: The intrinsic value and NPV calculations refresh in real-time.
- Test Scenarios: Generate various forecasts and instantly compare results.
- Make Decisions: Utilize the valuation findings to inform your investment approach.
Why Choose This Calculator for AxoGen, Inc. (AXGN)?
- Accurate Data: Utilize real AxoGen financials for trustworthy valuation outcomes.
- Customizable: Modify essential parameters such as growth rates, WACC, and tax rates to align with your forecasts.
- Time-Saving: Pre-configured calculations save you from starting from ground zero.
- Professional-Grade Tool: Tailored for investors, analysts, and consultants in the healthcare sector.
- User-Friendly: An intuitive design and step-by-step guidance ensure accessibility for all users.
Who Should Use AxoGen, Inc. (AXGN)?
- Medical Students: Understand nerve regeneration techniques and apply them in clinical scenarios.
- Researchers: Utilize advanced models in your studies on nerve repair and regeneration.
- Healthcare Investors: Evaluate your investment strategies and analyze market trends for AxoGen, Inc. (AXGN).
- Industry Analysts: Enhance your analysis with a comprehensive, customizable valuation model specific to the biotech sector.
- Surgeons: Discover how innovative technologies are transforming surgical practices in nerve repair.
What the Template Contains
- Pre-Filled DCF Model: AxoGen, Inc.’s (AXGN) financial data preloaded for immediate use.
- WACC Calculator: Detailed calculations for Weighted Average Cost of Capital.
- Financial Ratios: Evaluate AxoGen, Inc.’s (AXGN) profitability, leverage, and efficiency.
- Editable Inputs: Change assumptions such as growth, margins, and CAPEX to fit your scenarios.
- Financial Statements: Annual and quarterly reports to support detailed analysis.
- Interactive Dashboard: Easily visualize key valuation metrics and results.
Disclaimer
All information, articles, and product details provided on this website are for general informational and educational purposes only. We do not claim any ownership over, nor do we intend to infringe upon, any trademarks, copyrights, logos, brand names, or other intellectual property mentioned or depicted on this site. Such intellectual property remains the property of its respective owners, and any references here are made solely for identification or informational purposes, without implying any affiliation, endorsement, or partnership.
We make no representations or warranties, express or implied, regarding the accuracy, completeness, or suitability of any content or products presented. Nothing on this website should be construed as legal, tax, investment, financial, medical, or other professional advice. In addition, no part of this site—including articles or product references—constitutes a solicitation, recommendation, endorsement, advertisement, or offer to buy or sell any securities, franchises, or other financial instruments, particularly in jurisdictions where such activity would be unlawful.
All content is of a general nature and may not address the specific circumstances of any individual or entity. It is not a substitute for professional advice or services. Any actions you take based on the information provided here are strictly at your own risk. You accept full responsibility for any decisions or outcomes arising from your use of this website and agree to release us from any liability in connection with your use of, or reliance upon, the content or products found herein.