
|
Arrowmark Financial Corp. (BANX) DCF تقييم |
Fully Editable: Tailor To Your Needs In Excel Or Sheets
Professional Design: Trusted, Industry-Standard Templates
Investor-Approved Valuation Models
MAC/PC Compatible, Fully Unlocked
No Expertise Is Needed; Easy To Follow
ArrowMark Financial Corp. (BANX) Bundle
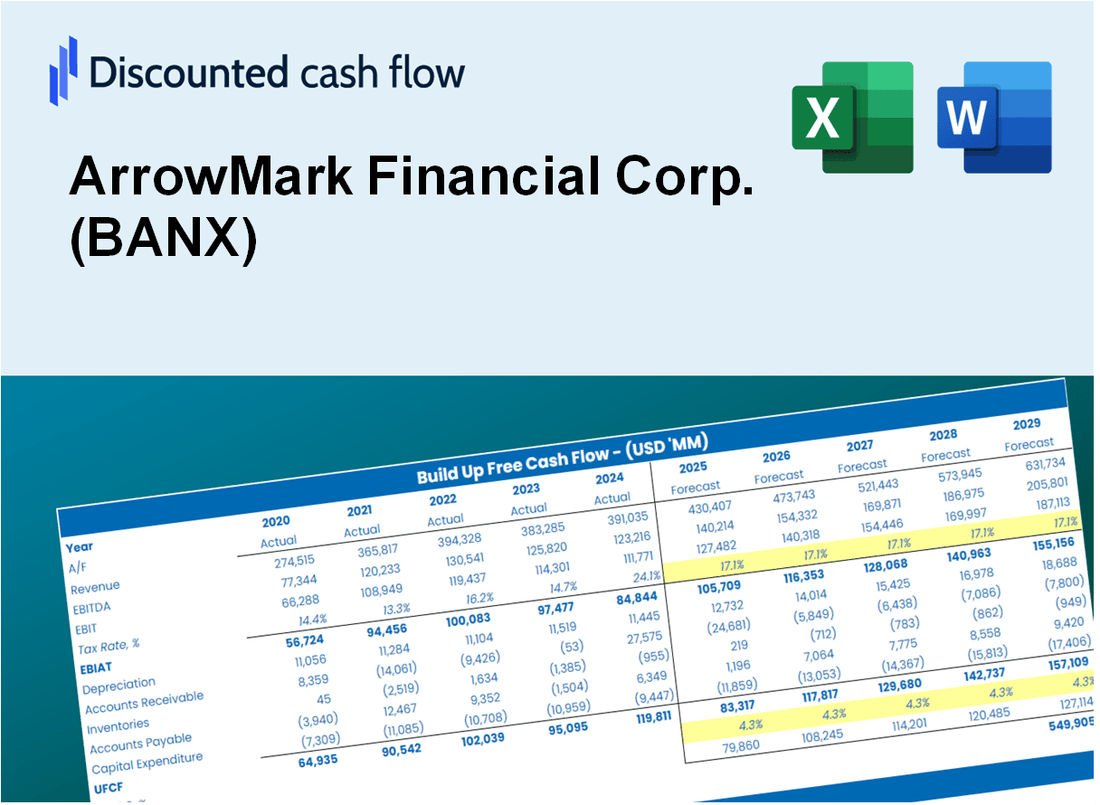
استكشف Outlook Financial من Arrowmark Financial Corp (BANX) مع حاسبة DCF سهلة الاستخدام! أدخل توقعاتك للنمو والهوامش والمصروفات لحساب القيمة الجوهرية لشركة Arrowmark Financial Corp (BANX) وتحسين نهج الاستثمار الخاص بك.
What You Will Get
- Real BANX Financial Data: Pre-filled with ArrowMark Financial Corp.’s historical and projected data for precise analysis.
- Fully Editable Template: Modify key inputs like revenue growth, WACC, and EBITDA % with ease.
- Automatic Calculations: See ArrowMark Financial Corp.’s intrinsic value update instantly based on your changes.
- Professional Valuation Tool: Designed for investors, analysts, and consultants seeking accurate DCF results.
- User-Friendly Design: Simple structure and clear instructions for all experience levels.
Key Features
- 🔍 Real-Life BANX Financials: Pre-filled historical and projected data for ArrowMark Financial Corp.
- ✏️ Fully Customizable Inputs: Adjust all critical parameters (yellow cells) like WACC, growth %, and tax rates.
- 📊 Professional DCF Valuation: Built-in formulas calculate ArrowMark’s intrinsic value using the Discounted Cash Flow method.
- ⚡ Instant Results: Visualize ArrowMark’s valuation instantly after making changes.
- Scenario Analysis: Test and compare outcomes for various financial assumptions side-by-side.
How It Works
- Step 1: Download the prebuilt Excel template featuring ArrowMark Financial Corp.'s (BANX) data.
- Step 2: Navigate through the pre-filled sheets to familiarize yourself with the essential metrics.
- Step 3: Adjust forecasts and assumptions in the editable yellow cells (WACC, growth, margins).
- Step 4: Instantly view updated results, including ArrowMark Financial Corp.'s (BANX) intrinsic value.
- Step 5: Utilize the outputs to make informed investment decisions or create reports.
Why Choose ArrowMark Financial Corp. (BANX) Calculator?
- User-Friendly Interface: Tailored for both novice and seasoned users.
- Customizable Inputs: Adjust parameters easily to suit your financial assessments.
- Real-Time Feedback: Witness immediate updates to ArrowMark's valuation as you modify inputs.
- Preloaded Data: Comes with ArrowMark’s current financial metrics for swift evaluations.
- Preferred by Experts: Utilized by financial analysts and investors for strategic decision-making.
Who Should Use ArrowMark Financial Corp. (BANX)?
- Finance Students: Master investment strategies and apply them using real-world examples from ArrowMark Financial Corp. (BANX).
- Academics: Utilize ArrowMark's financial models in your research or educational materials.
- Investors: Evaluate your investment strategies and analyze performance metrics for ArrowMark Financial Corp. (BANX).
- Analysts: Enhance your analysis process with a tailored financial model specific to ArrowMark Financial Corp. (BANX).
- Small Business Owners: Discover how investment firms like ArrowMark Financial Corp. (BANX) assess market opportunities.
What the Template Contains
- Pre-Filled DCF Model: ArrowMark Financial Corp.’s (BANX) financial data preloaded for immediate use.
- WACC Calculator: Detailed calculations for Weighted Average Cost of Capital specific to ArrowMark Financial Corp. (BANX).
- Financial Ratios: Assess ArrowMark Financial Corp.’s (BANX) profitability, leverage, and efficiency.
- Editable Inputs: Modify assumptions such as growth, margins, and CAPEX to tailor your scenarios for ArrowMark Financial Corp. (BANX).
- Financial Statements: Annual and quarterly reports for ArrowMark Financial Corp. (BANX) to facilitate in-depth analysis.
- Interactive Dashboard: Effortlessly visualize key valuation metrics and results for ArrowMark Financial Corp. (BANX).
Disclaimer
All information, articles, and product details provided on this website are for general informational and educational purposes only. We do not claim any ownership over, nor do we intend to infringe upon, any trademarks, copyrights, logos, brand names, or other intellectual property mentioned or depicted on this site. Such intellectual property remains the property of its respective owners, and any references here are made solely for identification or informational purposes, without implying any affiliation, endorsement, or partnership.
We make no representations or warranties, express or implied, regarding the accuracy, completeness, or suitability of any content or products presented. Nothing on this website should be construed as legal, tax, investment, financial, medical, or other professional advice. In addition, no part of this site—including articles or product references—constitutes a solicitation, recommendation, endorsement, advertisement, or offer to buy or sell any securities, franchises, or other financial instruments, particularly in jurisdictions where such activity would be unlawful.
All content is of a general nature and may not address the specific circumstances of any individual or entity. It is not a substitute for professional advice or services. Any actions you take based on the information provided here are strictly at your own risk. You accept full responsibility for any decisions or outcomes arising from your use of this website and agree to release us from any liability in connection with your use of, or reliance upon, the content or products found herein.