
|
Couchbase ، Inc. (قاعدة) تقييم DCF |
Fully Editable: Tailor To Your Needs In Excel Or Sheets
Professional Design: Trusted, Industry-Standard Templates
Investor-Approved Valuation Models
MAC/PC Compatible, Fully Unlocked
No Expertise Is Needed; Easy To Follow
Couchbase, Inc. (BASE) Bundle
عزز استراتيجياتك الاستثمارية مع Couchbase، Inc. (قاعدة) حاسبة DCF! استخدم البيانات المالية الفعلية لـ Couchbase، واضبط توقعات النمو والنفقات، ولاحظ على الفور كيف تؤثر هذه التغييرات على القيمة الجوهرية لشركة Couchbase، Inc. (BASE).
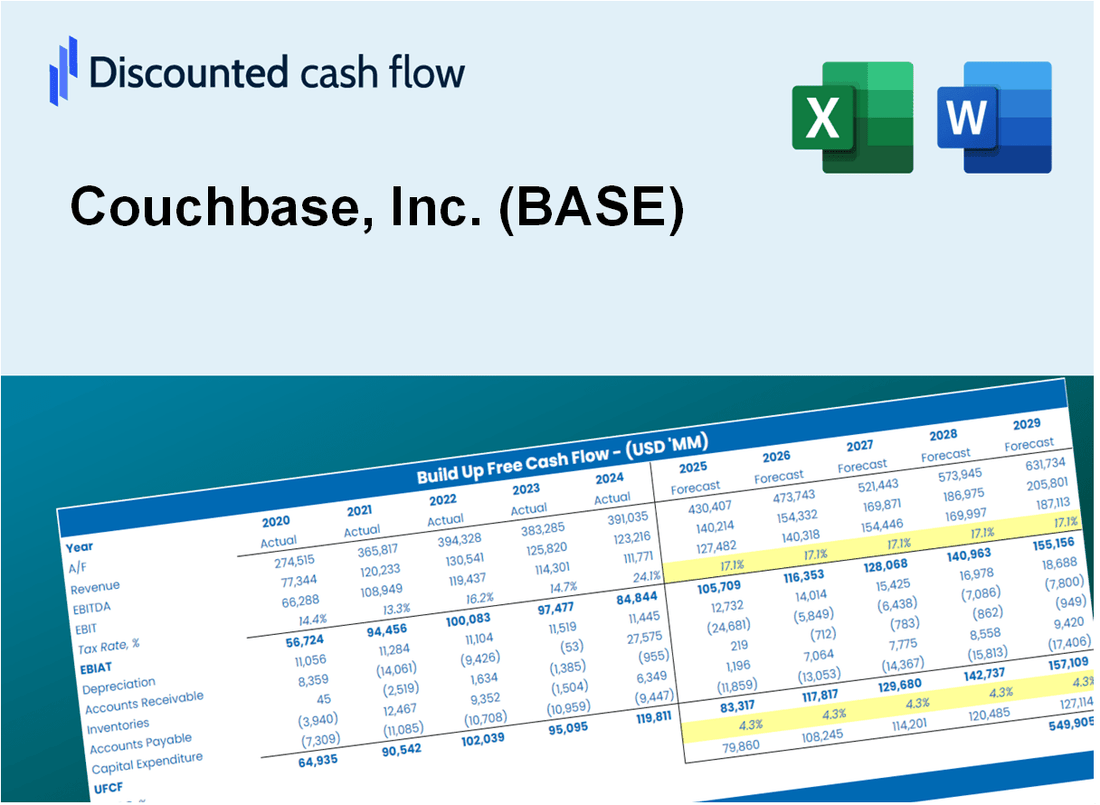
Discounted Cash Flow (DCF) - (USD MM)
| Year | AY1 2021 |
AY2 2022 |
AY3 2023 |
AY4 2024 |
AY5 2025 |
FY1 2026 |
FY2 2027 |
FY3 2028 |
FY4 2029 |
FY5 2030 |
|---|---|---|---|---|---|---|---|---|---|---|
| Revenue | 103.3 | 123.5 | 154.8 | 180.0 | 209.5 | 250.1 | 298.6 | 356.5 | 425.6 | 508.1 |
| Revenue Growth, % | 0 | 19.61 | 25.32 | 16.28 | 16.35 | 19.39 | 19.39 | 19.39 | 19.39 | 19.39 |
| EBITDA | -30.0 | -53.7 | -64.2 | -76.4 | -70.5 | -95.1 | -113.5 | -135.5 | -161.8 | -193.1 |
| EBITDA, % | -29.01 | -43.49 | -41.46 | -42.41 | -33.66 | -38.01 | -38.01 | -38.01 | -38.01 | -38.01 |
| Depreciation | 2.0 | 2.8 | 6.1 | 2.4 | 2.3 | 5.3 | 6.3 | 7.6 | 9.0 | 10.8 |
| Depreciation, % | 1.94 | 2.29 | 3.93 | 1.35 | 1.09 | 2.12 | 2.12 | 2.12 | 2.12 | 2.12 |
| EBIT | -32.0 | -56.6 | -70.3 | -78.8 | -72.8 | -100.3 | -119.8 | -143.0 | -170.8 | -203.9 |
| EBIT, % | -30.95 | -45.78 | -45.38 | -43.76 | -34.75 | -40.13 | -40.13 | -40.13 | -40.13 | -40.13 |
| Total Cash | 56.8 | 206.0 | 168.3 | 153.6 | 147.2 | 205.4 | 245.2 | 292.8 | 349.5 | 417.3 |
| Total Cash, percent | .0 | .0 | .0 | .0 | .0 | .0 | .0 | .0 | .0 | .0 |
| Account Receivables | 35.9 | 36.7 | 39.8 | 44.8 | 49.2 | 69.3 | 82.8 | 98.8 | 118.0 | 140.9 |
| Account Receivables, % | 34.76 | 29.7 | 25.74 | 24.91 | 23.51 | 27.72 | 27.72 | 27.72 | 27.72 | 27.72 |
| Inventories | 10.5 | 11.8 | 13.1 | .0 | .0 | 14.1 | 16.8 | 20.1 | 24.0 | 28.7 |
| Inventories, % | 10.2 | 9.54 | 8.46 | 0 | 0 | 5.64 | 5.64 | 5.64 | 5.64 | 5.64 |
| Accounts Payable | 2.4 | 1.9 | 1.4 | 4.9 | 2.2 | 4.3 | 5.1 | 6.1 | 7.3 | 8.7 |
| Accounts Payable, % | 2.35 | 1.56 | 0.90877 | 2.7 | 1.04 | 1.71 | 1.71 | 1.71 | 1.71 | 1.71 |
| Capital Expenditure | -2.8 | -.8 | -5.6 | -4.7 | -3.0 | -5.6 | -6.6 | -7.9 | -9.4 | -11.3 |
| Capital Expenditure, % | -2.73 | -0.66293 | -3.65 | -2.62 | -1.44 | -2.22 | -2.22 | -2.22 | -2.22 | -2.22 |
| Tax Rate, % | -2.47 | -2.47 | -2.47 | -2.47 | -2.47 | -2.47 | -2.47 | -2.47 | -2.47 | -2.47 |
| EBITAT | -32.8 | -57.6 | -71.3 | -80.1 | -74.6 | -100.3 | -119.8 | -143.0 | -170.8 | -203.9 |
| Depreciation | ||||||||||
| Changes in Account Receivables | ||||||||||
| Changes in Inventories | ||||||||||
| Changes in Accounts Payable | ||||||||||
| Capital Expenditure | ||||||||||
| UFCF | -77.6 | -58.1 | -75.9 | -70.9 | -82.4 | -132.7 | -135.5 | -161.7 | -193.1 | -230.5 |
| WACC, % | 8.09 | 8.09 | 8.09 | 8.09 | 8.09 | 8.09 | 8.09 | 8.09 | 8.09 | 8.09 |
| PV UFCF | ||||||||||
| SUM PV UFCF | -664.5 | |||||||||
| Long Term Growth Rate, % | 2.00 | |||||||||
| Free cash flow (T + 1) | -235 | |||||||||
| Terminal Value | -3,864 | |||||||||
| Present Terminal Value | -2,619 | |||||||||
| Enterprise Value | -3,284 | |||||||||
| Net Debt | -26 | |||||||||
| Equity Value | -3,258 | |||||||||
| Diluted Shares Outstanding, MM | 51 | |||||||||
| Equity Value Per Share | -63.49 |
What You Will Receive
- Pre-Filled Financial Model: Couchbase’s actual data allows for accurate DCF valuation.
- Comprehensive Forecast Control: Modify revenue growth, profit margins, WACC, and other essential factors.
- Real-Time Calculations: Automatic updates provide immediate results as you make adjustments.
- Investor-Ready Template: A polished Excel file crafted for high-quality valuation.
- Customizable and Reusable: Designed for versatility, enabling multiple uses for in-depth forecasts.
Key Features
- Comprehensive Data: Couchbase, Inc.'s historical performance metrics and pre-filled projections.
- Customizable Parameters: Modify WACC, tax rates, revenue growth, and EBITDA margins as needed.
- Real-Time Insights: Observe Couchbase's intrinsic value adjustments live as inputs change.
- Intuitive Visualizations: Dashboard charts present valuation results and essential metrics clearly.
- Designed for Precision: A reliable tool tailored for analysts, investors, and finance professionals.
How It Works
- Download: Access the ready-to-use Excel file with Couchbase, Inc.'s (BASE) financial data.
- Customize: Adjust forecasts, including revenue growth, EBITDA %, and WACC.
- Update Automatically: The intrinsic value and NPV calculations update in real-time.
- Test Scenarios: Create multiple projections and compare outcomes instantly.
- Make Decisions: Use the valuation results to guide your investment strategy.
Why Choose the Couchbase Calculator?
- Accuracy: Utilizes real Couchbase financials to ensure precise data.
- Flexibility: Allows users to easily test and adjust inputs as needed.
- Time-Saving: Eliminate the need to create a financial model from the ground up.
- Professional-Grade: Crafted with the precision and usability standards of CFOs in mind.
- User-Friendly: Intuitive interface designed for users of all financial backgrounds.
Who Should Use This Product?
- Investors: Accurately assess Couchbase, Inc.'s (BASE) fair value prior to making investment choices.
- CFOs: Utilize a professional-grade DCF model for financial analysis and reporting.
- Consultants: Efficiently modify the template for client valuation reports.
- Entrepreneurs: Discover insights into financial modeling practices of leading tech firms.
- Educators: Employ it as a resource to illustrate valuation techniques in the classroom.
What the Template Contains
- Preloaded BASE Data: Historical and projected financial data, including revenue, EBIT, and capital expenditures.
- DCF and WACC Models: Professional-grade sheets for calculating intrinsic value and Weighted Average Cost of Capital.
- Editable Inputs: Yellow-highlighted cells for adjusting revenue growth, tax rates, and discount rates.
- Financial Statements: Comprehensive annual and quarterly financials for deeper analysis.
- Key Ratios: Profitability, leverage, and efficiency ratios to evaluate performance.
- Dashboard and Charts: Visual summaries of valuation outcomes and assumptions.
Disclaimer
All information, articles, and product details provided on this website are for general informational and educational purposes only. We do not claim any ownership over, nor do we intend to infringe upon, any trademarks, copyrights, logos, brand names, or other intellectual property mentioned or depicted on this site. Such intellectual property remains the property of its respective owners, and any references here are made solely for identification or informational purposes, without implying any affiliation, endorsement, or partnership.
We make no representations or warranties, express or implied, regarding the accuracy, completeness, or suitability of any content or products presented. Nothing on this website should be construed as legal, tax, investment, financial, medical, or other professional advice. In addition, no part of this site—including articles or product references—constitutes a solicitation, recommendation, endorsement, advertisement, or offer to buy or sell any securities, franchises, or other financial instruments, particularly in jurisdictions where such activity would be unlawful.
All content is of a general nature and may not address the specific circumstances of any individual or entity. It is not a substitute for professional advice or services. Any actions you take based on the information provided here are strictly at your own risk. You accept full responsibility for any decisions or outcomes arising from your use of this website and agree to release us from any liability in connection with your use of, or reliance upon, the content or products found herein.